Scaling_mastery:Free TrendlinesScaling_mastery Trendlines is a clean, trading-ready smart trendline tool built for the Scaling_mastery community.
It automatically finds swing highs/lows and draws dynamic trendlines or channels that stay locked to price, on any symbol and any timeframe.
🔧 Modes
Trendline type
Wicks – classic trendlines anchored on candle wicks (high/low).
Bodies – trendlines anchored on candle bodies (open/close), great for closing structure.
Channel – 3-line channel:
outer lines form a band around price
middle line runs through the centre of the channel
thickness is adjustable (Small / Medium / Large).
Trend strength
Controls how strong the pivots must be to form a line.
Weak → more lines, reacts faster.
Medium → balanced, good for most pairs.
Strong → only the cleanest swings, higher-probability trendlines.
🎨 Visual controls
Max support / resistance lines – cap how many lines are kept on chart.
Show broken lines – hide broken trendlines or keep them for structure history.
Extend lines – None / Right / Both.
Support / Resistance colors – separate colors for active vs broken.
Channel thickness – Small / Medium / Large (0.5% / 1% / 2% of price).
Channel outer lines – color for channel edges.
Channel middle line – color + style (dotted / dashed / solid).
Broken lines are automatically faded + dotted, so you can instantly see what’s still respected and what’s already been taken out.
🧠 How to use
Add the indicator to any chart.
Start with:
Trendline type: Wicks
Trend strength: Strong
Max lines: 1–2 for both support & resistance
Once you like the behavior, experiment with:
Switching between Wicks / Bodies / Channel
Adjusting Channel thickness and Trend strength
Use the lines as a visual confluence tool with your own strategy:
HTF trend direction
LTF entries / retests
Liquidity grabs around broken lines
This script doesn’t generate entries or risk management – it’s designed to give you clean, reliable structure so you can execute your own edge.
⚠️ Disclaimer
This tool is for educational and visual purposes only and is not financial advice.
Always do your own research and manage risk.
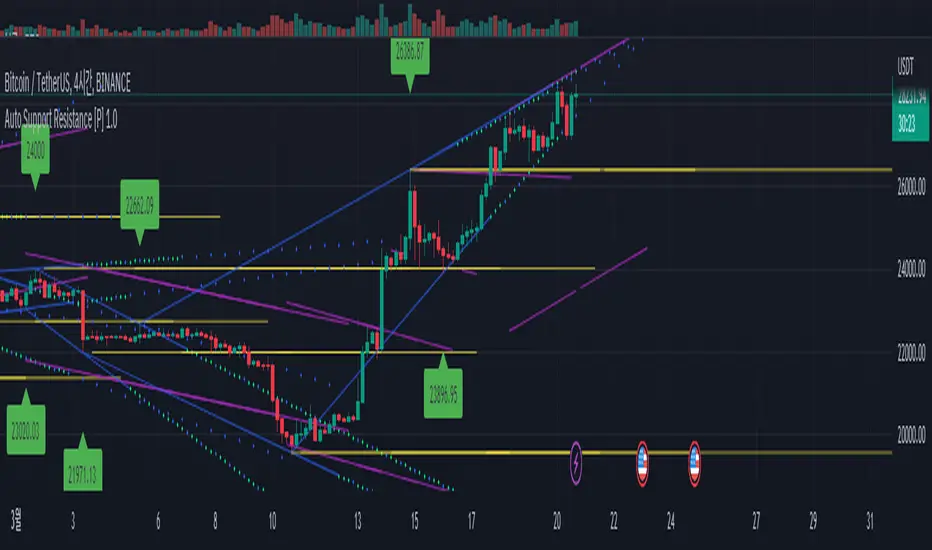
Auto-trendline

Auto Support Resistance [WS]This is paid version.
If you wanna use free version
This show support line, and resistance line.
moderately! and beautiful way!
also proper trend line .
you cannot see source code, but it doesnt have any secret formula.
It use just pivot function.
( i just wanna keep my design tech. )
it has 3 type line.
1. horizontal. yellow. default pivot size is 15
2. connection of top(peak, blue). pivot size 10
3. connection of bottom(green). pivot size 10
you can change pivot size.
it has one speical option about volume .
if the bottom has too small volume , it cannot be starting point.
if you want every bottom can be starting point, you can turn off the option.
each point has name like H6, G8.
this name help you to talk with someone about the point, sharing the infomation.
that name is base on the time of candle (it mean it is not randome). so in your friend chart(screen), the point has same name.
=========================================
한글 설명.
이 지표는 유료버전입니다.
무료버전은 위의 그림을 누르시면 됩니다.
아름답게 절제된, 그리고 적절한 추세선들을 자동으로 보여줍니다!!!
소스코드를 볼 수 없지만, 추세선을 결정하는 비밀 수식 같은 것은 없습니다.
오직 pivot피봇 함수만을 사용하여 고점과 저점을 찾고 있습니다.
선은 3가지가 있습니다.
1. 고점을 연결한 선. 파란색. 기본 피봇 10
2. 저점을 연결한 선. 녹색. 피봇 10
3. 고점 또는 저점의 수평선. 노란색. 피봇 15
특별한 기능이 하나 있는데, 볼륨이 낮은 저점은 녹색선의 시작점이 되지 못하게 하는 기능입니다.
이 기능은 옵션에서 끄거나, 정도를 조절할 수 있습니다.
각 고점 저점은 H4, G8 같은 이름을 가지고 있습니다.
이 이름은 여러분이 차트분석을 올리거나 친구와 차트에 대해 대화를 나눌 때 유용하게 쓰일 수 있습니다.
이 이름은 캔들의 시간값을 이용하며 (무작위로 지어진게 아니라는 의미), 그래서 친구의(모두의) 화면에서 같은 이름을 보여줍니다.
점선은 확장선이며, 기본은 30, 최대 55까지 늘릴 수 있습니다.
(너무 늘리면 화면이 복잡해집니다.)
가장 최근의 고점과 저점 수평선은 무한대의 길이를 가집니다.
그 외의 수평선은 적당한 길이로 조절되어 출력됩니다.
간혹 3개의 선으로 나뉘어 보이거나 투명도가 변하곤 하는데 이는 특별한 의미를 보이려는 것이 아닙니다. 트레이딩뷰 파인스크립트의 한계로 인한 현상입니다.
TrendLine ChannelsAbstract
This script provides a set of Trendline Channels which can be tighter than Donchian Channels.
This script computes the most suitable active upper and lower trendlines and updates them as soon as possible.
We can use it for breakout signals earlier than Donchian Channels.
Introduction
Channels are tools which can mark area of values of ranging markets.
Once the price leaves the original region, range traders may start admitting they are wrong and trigger trend.
Donchian Channels (misheard as Dungeon Channels) use the highest and the lowest price to define area of values.
When the price breakouts, it just like it got released from a dungeon.
However, waiting for the price making even higher or lower may be too late and risk reward ratio may be lower.
Trendlines can make the channels tighter and we can find earlier breakout signals.
Computing Trendline Channels
(1) Find the most active trendlines
In this script, a valid trendline connects two high values or two low values.
A high value means the highest value in a trading day.
A low value means the lowest value in a trading day.
In this script, every trendline does not crossover any bar but can exactly touch them.
The most flat trendline is taken. (one for upper and one for lower)
(2) Continue to use or Change a trendline
If there is a tighter trendline available, this script changes to use it.
If the previous active trendline is broken, this script re-computes the trendline available.
When this case happens, this script display with an another color.
Otherwise, this script continues using the previous trendline.
(3) Middle line
The middle line indicates the middle value between the upper and the lower.
Parameters
Length : how many days are used for computation. The default value is 16 just because 16=4*4, using binary characteristic.
x_go_on : If the previous trendline is not breakout and there are no tighter trendlines available, we continue use it.
Color Options
(1) Upper trendline (no update or tighter)
(2) Upper trendline (changed due to breakout)
(3) Middle line
(4) Lower trendline (no update or tighter)
(5) Lower trendline (changed due to breakout)
Conclusion
Trendline Channels can be tighter than Donchian Channels and evaluate earlier breakout signals.
Comparing to known auto trendline scripts, Trendline Channels is continuous.
Once a trendline is broken, Trendline Channels can instantly point out the next available one.
If you think the price movement is boring or you cannot have good risk reward ratio, you can go to an another timeframe.
Reference
How to trade with Donchian Channels
How to trade with Trendlines
