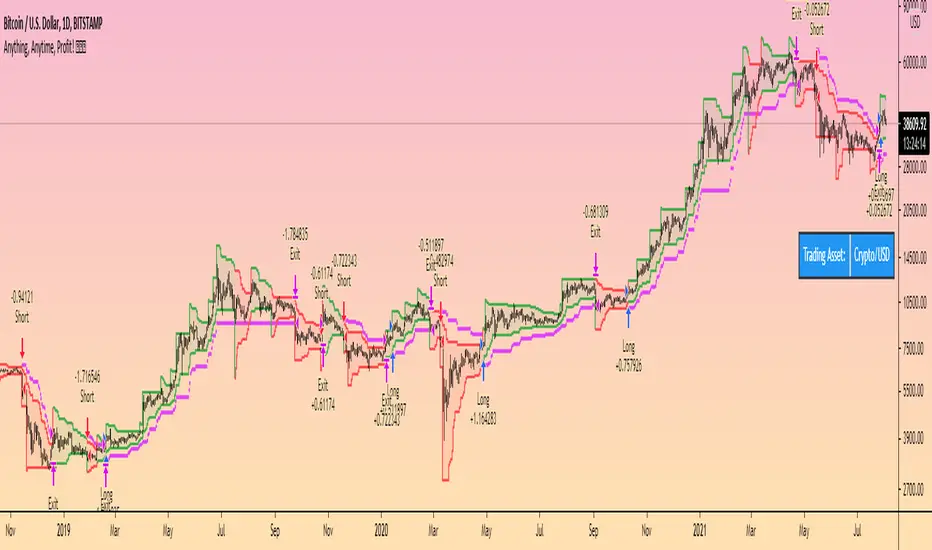
Bull Market Trend Following StrategyThis Bull Market Trend Following Strategy is perfect for long or short term Crypto or traditional market trading and investing.
It is based mainly on the ATR indicator and will therefore adapt to any market conditions and volatility.
It has a number of variable options to try and maximise gains, including stop loss and take profit points, and the ability to wait for pullbacks.
Please let me know if you find any optimal settings, and don't hesitate to ask any questions I'm always happy to help.
Thanks a lot.
ATR
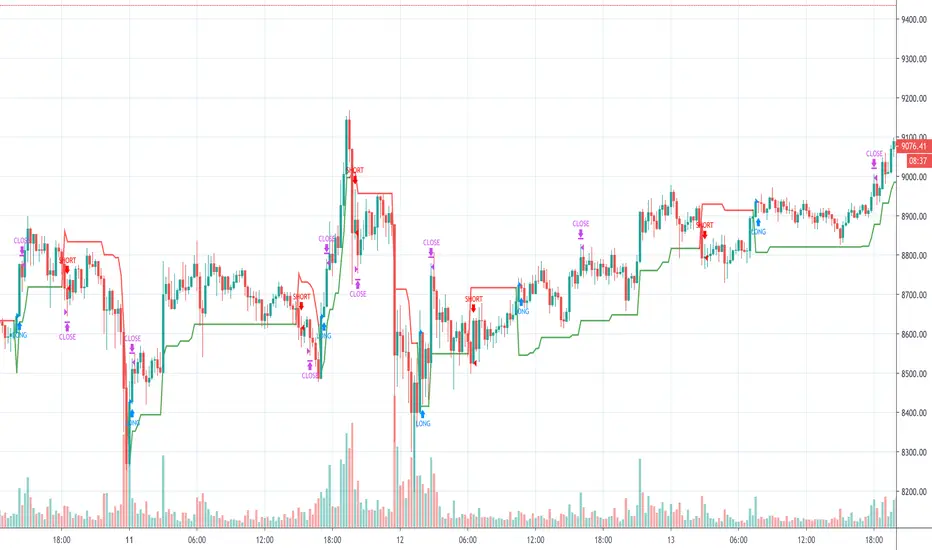
ATR + %R Scalping StrategyThe Average True Range is a single line indicator that measures volatility. The indicator was originally developed by J. Welles Wilder to measure the volatility of commodities within the futures market.
ATR does not measure price trends or price direction hence %R and Parabolic SAR indicators were added.
The strategy enhances standard Average True Range and %R composition with trend confirmation and filters which clear out market noises and manipulations from triggers.
The strategy supports traditional and cryptocurrency spot, futures, options and marginal trading exchanges. It works accurately with BTC, USD, USDT, ETH and BNB quote currencies. Best to use with 5 and 15 minutes timeframe charts and Limit orders.
The strategy can be and should be configured for each particular asset. You can change filters and risk management settings to receive the most advanced accurate alerts
Advantages of this script:
Strategy has high profit factor around 30.32
Backtests show high accuracy around 91.18%
High Net Profit percentage
Low Drawdowns
Weak signals are filtered
Dynamic Take profit and Stop loss
Fast deals around 50 minutes per trade
Can be applied to any market and quote currency
Easy to configure user interface
How to use?
1. Apply strategy to the trading pair your are interested in at 5m or 15m timeframe chart
2. Configure the strategy: change filters values and risk management settings until Strategy tester shows good results according to mathematical expectation
3. Set up a TradingView alert to trigger when strategy conditions are met
4. Strategy will send alerts when to enter and when to exit positions

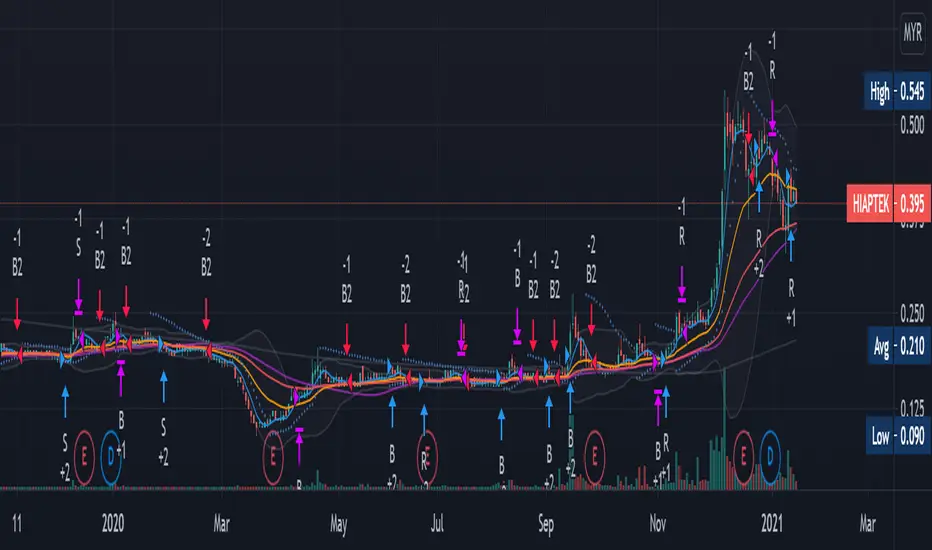
Renovation-10 (Including 10 Traditional Indicators)This idea is not rare. It is just a combination of 10 most well know and traditional Indicators to form one renovated indicator. There are Moving Average (MA), Volume (V), Bollinger Band (BB), Relative Strength Index ( RSI ), Stochastic RSI, Modified Stochastic RSI, Moving Average Convergence Divergence ( MACD ), Average directional index ( ADX ), Average True Range (ATR) and Parabolic Stop and Reverse (PSAR). These indicators most I found was just showing entering position strategic alone. I just want to know how well them work together when combination. I modified many times and thinking for the strategic enter and exist position with the choice of these 10 indicators to maximize the profitability which shows in strategic tester in every stock and conditions.
THEORY:
Fluctuation of price is like a Wave which I categorized it into four period. They are Sideway, Breakout Positive and Negative, Retracement and Consolidation. Breakout is rare to happen, either go up or go down. After a breakout usually will have small retracement, then trend will go for sideway. After long period of sideway, the wave is starting to run out of energy and there will be consolidation period.
STRATEGIC OPTION:
S: Sideway Period
B: Breakout Period
R: Retracement Period
(+): Buy
(-): Sell
PROBLEM:
1. Not performing very well at very penny stock which the graph looks like barcode.
Suggesting can change daily graph to weekly graph to avoid.
2. Be careful with Sideway entry signal because sometimes price may continue go down. You will stuck at middle if you enter without confirmation.
Confirm the price is stable at support by current low is higher or equal to past three to five day low before entry.
3.Always remember Breakout is rare, do not push for luck
Always make profit at Sideway and Retracement trend. Can Sell half only at BB when breakout buying signal is available, to avoid losing chance of chasing breakout.
4. Breakout selling signal 2 may delay
After breakout, make sure sell all when 2-3 red candle appeared or When BB is squeezing.
5. Other tools may required to confirm entry position.
These combination strategic is more to personal experiences and knowledges, it hard to adjust in coding for strategic position.
This is my first publication and I just do it for fun, having fun in reading the script and creating own ideas.
Information provided is only educational and sharing , should not be used to take action in the markets.
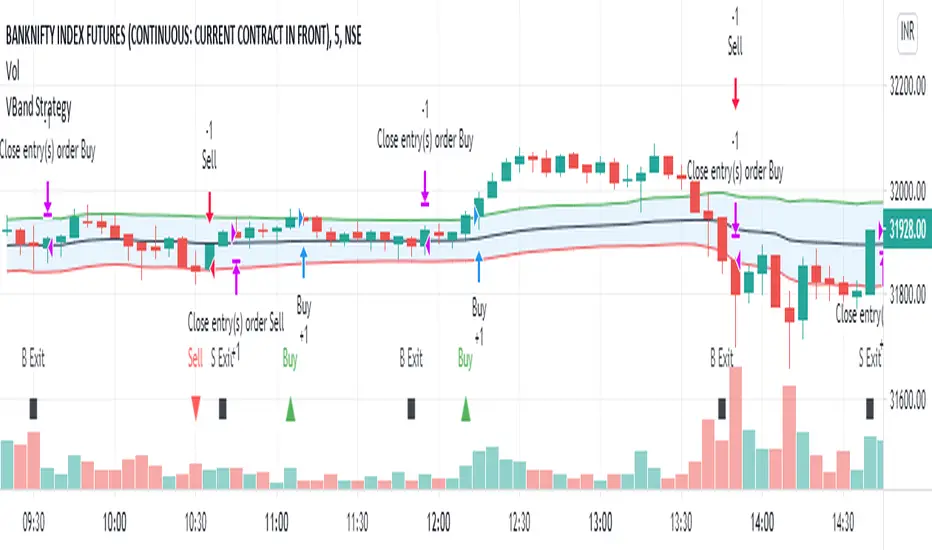
VBand StrategyVBand Strategy is simply used Vwap funcation and atr 14 for find the entry and exit points. This simple Strategy.
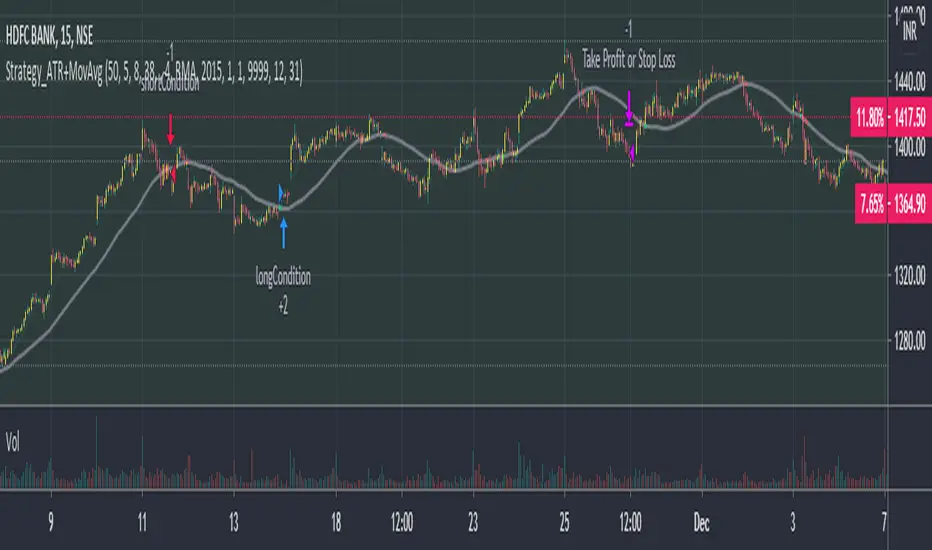
Phoenix085-Strategies==>MTF - Average True Range + MovAvgFIRSTLY, Here are a few who have influenced my pinescripting immensely recently:
@JustUncleL
@BigBitsIO
@TheArtofTrading
@QuantNomad
@SquigglesNiggles and many many many more.
Overview:
> This indicator is a simple crossover of Moving Averages.
> In addition I am using ATR rising as an indication for Trending Price.
> The entry is made once the smaller moving average crosses the bigger moving average, and also the Closes above the Smaller moving average.
> but the only twist here is,
- the ATR source is One timeframe Higher(In this case same as the session).whereas the source for the Moving averages is one Timeframe Lower.
>i.e., if the Session is 1D, the Indicator checks if the ATR is rising in the DAILY TIMEFRAME,
*_* the trade entry is made once the MOVING AVERAGE crossover happens on ONE TIME FRAME lower, as per example, ATR --> 1D = MA -->4H.
> Moving Average ->
- Thick -> Bigger MA,
- Thin and Transparent -> Smaller MA,
> Also, the Color of the Thicker MOVING AVERAGE Changes as Below:
- When LongCondition is satisfied --> Color=Lime
- When ShortCondition is satisfied --> Color=Red
- When neither condition is satisfied --> Color=Gray
NOTE:
1) There is a limitation in using the Securities function for FREE USERS --> Only 500 bars are allowed. So to use the indicators with more data, you need an upgraded TV account.
2) Strategy still needs Fine tuning, but for now, use the Thicker moving average color LIME FOR LONG ENTRIES and RED FOR SHORT ENTRIES.
This is Free for Use and share
MACD Strategy with trailing ATR stopThis is a trend based strategy that uses EMA and SMA intersection for determining the direction of the trend and MACD for the entry signal. At the same time, the strategy uses ATR, which is working as a trailing stop.
The strategy entry will work when the Trend ribbon will turn green and MACD line will crossover the signal line. This strategy also takes into account the pyramiding and allows to enter the second time if the signal will repeat itself.
There are 3 exit points. The first 10% of the position will be closed when the price will increase by 1%. The second portion of 50% will be closed when the price reaches 5% Take profit target. The remaining 40 % of the position will wait for the exit signal which will occur when the price closes below the ATR line.
The strategy is using a fixed amount in dollars, each time the entry occurs the strategy will enter with 100$ in the order.
The strategy can be applied to other crypto assets. However, they will require input changes.
Best of luck with your trading.

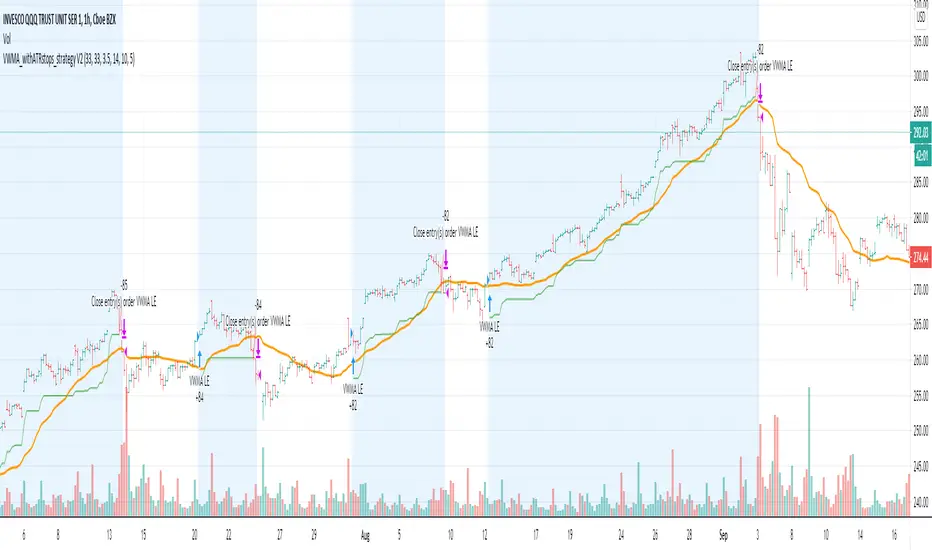
VWMA_withATRstops_strategyThis strategy follows the trend when price is above VWMA indicator. I have modified entry and exit rules to get most out of it.
Instead of entering LONG when price crosses above VWMA, I have used RSI(14) of VWMA . that way it skips the false signals. (some extent)
ENTRY
========
1. VWMA setting is 33
2. When RSIofVwma is above 30 enter Long ( and also checks if price already broke the ATR Stop above line )
Stop Loss and Exits
==================
1. Exit is when price breaks the ATR stop loss
2. ATR setting is set as same VWMA Length and multiplier is 3.5
3. STOP Loss that I mentioned in the settings is being used to calculate the how many units can be purchased based on risk of capital value.
Note: There is NO hard stop loss. having above ATR stop loss works as Trailing stop loss
Warning
=======
For the educational purposes only
Wilder's Volatility Trailing Stop Strategy with various MA'sFor Educational Purposes. Results can differ on different markets and can fail at any time. Profit is not guaranteed.
This only works in a few markets and in certain situations. Changing the settings can give better or worse results for other markets. This strategy is based on Wilder's Volatility System. It is an ATR trailing stop that is used for long term trends. This strategy focuses on the trailing stop alone and goes long and short only when it goes above or below the trailing line. It is similar to Donchian channels except it does not include the certain period channel breakout, only the trailing signal. This is only the trailing stop and an attempt to show how well it works standalone as Wilder described.
In his book, Wilder recommends a multiplier of 2.8-3.1 and an ATR lookback of 7 periods along with a running moving average or otherwise known as Wilder's moving average. The calculation and programming part for the trailing stop varies everywhere. I opted to keep it as simple and accurate as I could think of and interpret from the book. The variations to these types of indicators are numerous unfortunately, but Wilder seems to be the original author of ATR and this ATR-based trailing stop. In his book he says to use the significant closing price or highest/lowest closing price for the calculation part but I also included the option of choosing the highest high and lowest low, and the option to choose various moving averages in case anyone wants to experiment.
Comparing this and Donchian channels, it seems that a 2.5 multiplier is somewhat similar to the middle band of DCs and a 3.0 multiplier is somewhat similar to a double length middle band of DCs. It's hard to say which is the better trailing stop for a long term strategy. It's hard to beat the simplicity of DCs but maybe some might find a need for more inputs in a trailing stop or maybe an ATR based one like Wilder's can work better depending on what setting or strategy it's used in.

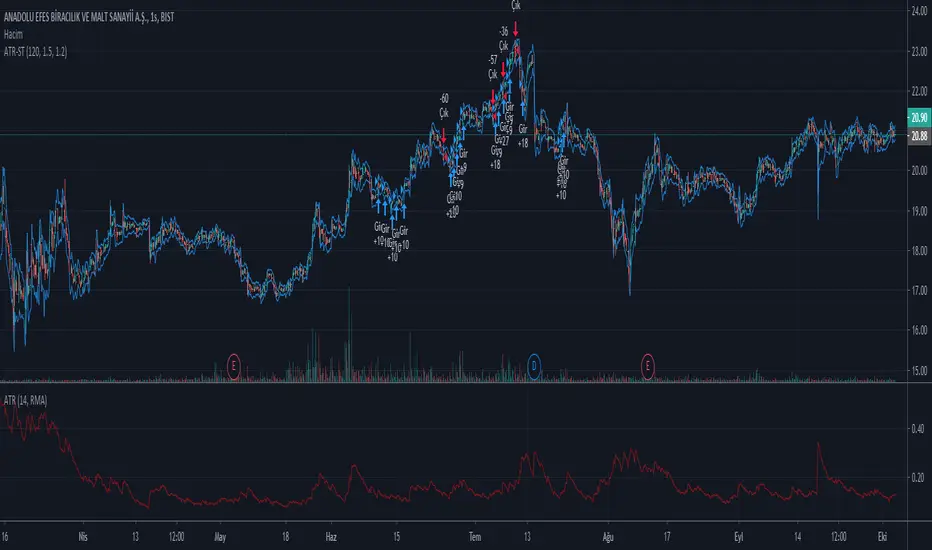
Profit Maximizer PMax Strategy - Long-ShortI developed a different strategy perspective for the Profit Maximizer PMax indicator prepared by Kıvanç Özbilgiç.
When you come to the settings section;
- You will see 2 options as Straregy Type. You can test the price and pmax intersections as different strategies.
- I added the Long-Short option for spot traders to calculate the profitability rate correctly. Spot traders should not choose this option.
Here you can set alarms on the original indicator with the parameters you find successful.
Türkçe:
Kıvanç Özbilgiç tarafından hazırlanan Profit Maximizer PMax indikatör için farklı bir strateji bakış açısı geliştirdim.
Ayarlar bölümüne geldiğinizde;
- Straregy Type olarak 2 seçenek göreceksiniz. Fiyat kesişimi ve pmax kesişimlerini, farklı stratejiler olarak test edebilirsiniz.
- Spot işlem yapanlar için karlılık oranını doğru hesaplayabilmeleri için Long-Short seçeneği ekledim. Spot işlem yapanların bu seçeneği seçmemeleri gerekmektedir.
Burada başarılı bulduğunuz parametreler ile orijinal indikatör üzerinde alarmlar kurabilirsiniz.

ATR Stop Buy StrategyThis strategy trial is let you to giving sell and buy orders with ATR (average true range) and an coefficent for them. it is my first strategy work, needs to be upgraded. USE IT WITH YOUR OWN RISK. IT IS NOT EVEN GUARANTEED TO WORK.
2 Candles Inside ATR2 agitated candles falling inside ATR range, awaiting possibly a big move.
Buy / Sell signals at combined high / low can be used as order with other as stop loss.
Counter trade, when this minimal stop loss is hit, is also as useful. However, wait till the SL candle closes, before opening position on the other side.
Works quite well on 15 mins chart, with settings of ATR duration 25 and multiplier 0.6. These settings are configurable, so feel free.

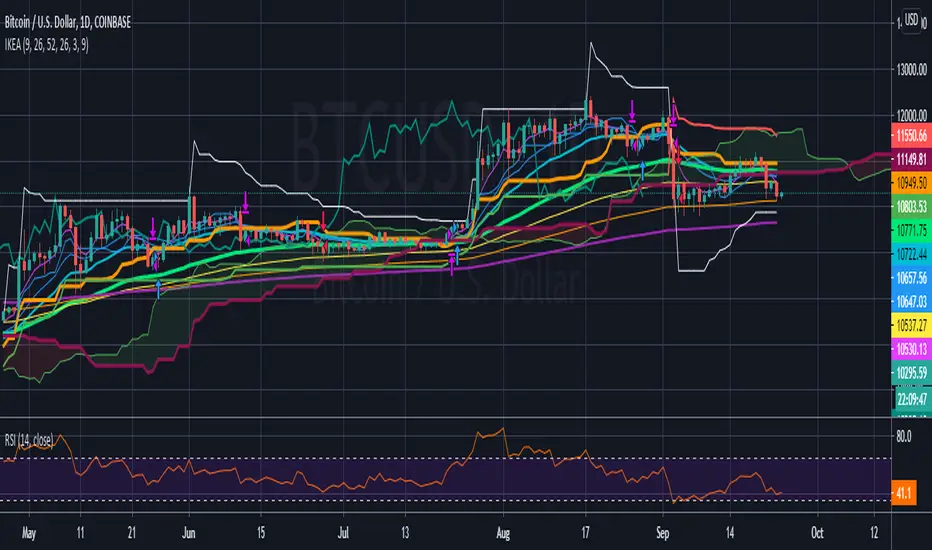
Ichimoku Kinko Hyo Strategy+ EMA + 3ATRThis trading strategy uses combination of the Ichimoku Kinko Hyo system with Fibonacci numbers based 13/21/55 exponential moving average ( EMA ) crossover, giving good results in various trending assets !
Also has the Trend-following indicator combining SuperTrend with Chiku breakout from Ichimoku is added in order to confirm trend pattern.
The Ichimoku Kinko Hyo system includes five kinds of signal, of which this strategy uses the most recent of ones i.e. Tenkan Sen / Kijun Sen Cross and price crosses the Kijun Sen. As the Chikou Span, Senkou Span A and Senkou Span B are shifted into the past/future.
The Tenkan Sen, also known as the Turning or Conversion line, is a moving average of the highest high and lowest low over the last 9 periods in this strategy.
The Kijun Sen, also known as the Standard or Base line, is a moving average of the highest high and lowest low over the last 26 periods in this strategy.
The Chikou Span, also known as the Lagging line, is the closing price plotted 26 periods behind in this strategy.
The Senkou Span A, also known as the 1st leading line, is a moving average of the Tenkan Sen and Kijun Sen and is plotted 26 periods ahead in this strategy.
The Senkou Span B, also known as the 2nd leading line, is a moving average of the highest high and lowest low over the last 52 trading days is plotted 26 periods ahead in this strategy.
EMA is quicker to react to the current market price is because EMA gives more importance to the most recent data points. This helps the trader to take quicker trading decisions. Just used the laws of nature for EMA numbers: taken from Fibonacci sequence numbers 13/21/55
A SuperTrend employs ATR values to calculate the indicator values. The SuperTrend indicator combined with Chiku breakout from Ichimoku and plotted. The indicator line changes its color between green and red based on the price momentum in the underlying.
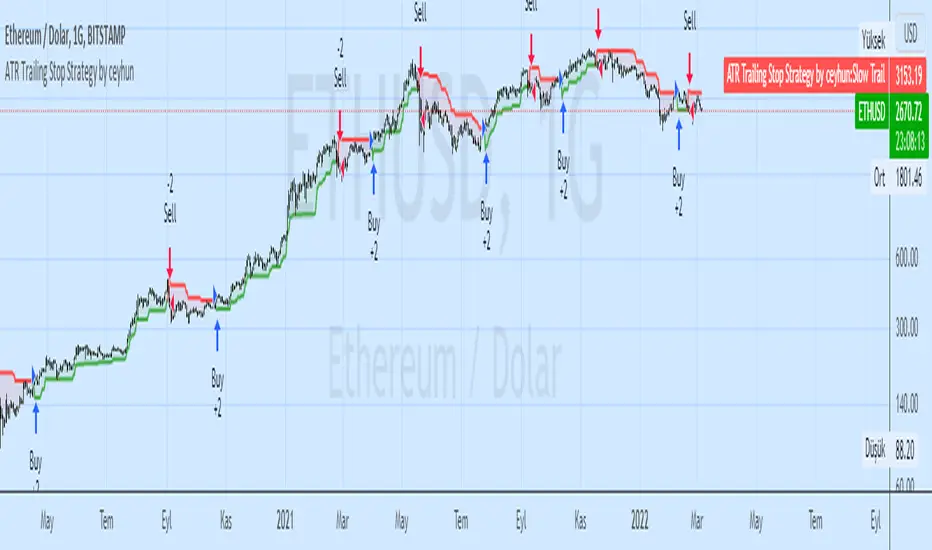
ATR Trailing Stop Strategy by ceyhunSame coding only coloring and strategy version added
//Barcolor
Green = Trail1 > Trail2 and close > Trail2 and low > Trail2
Blue = Trail1 > Trail2 and close > Trail2 and low < Trail2
Red = Trail2 > Trail1 and close < Trail2 and high < Trail2
Yellow = Trail2 > Trail1 and close < Trail2 and high > Trail2
//It gives White color where there is deterioration.
Let's not use InfoPanel in strategy, it would be wrong as it signals the next day.
ATR Trailing Stoploss StrategyI am sharing the strategy version of the indicator used before. It is very simple to use.
These are the settings I use, you can change, test and use as you wish.
Atr Period 5
Highest High Period 10
Multiplier 2.5
It can generate more signals in shorter time frames.
The success rate will be higher in longer time frames.

Full strategy AllinOne with risk management MACD RSI PSAR ATR MAHey, I am glad to present you one of the strategies where I put a lot of time in it.
This strategy can be adapted to all type of timecharts like scalping, daytrading or swing.
The context is the next one :
First we have the ATR to calculate our TP/SL points. At the same time we have another rule once we enter(we enter based on % risk from total equity, in this example 1%, at the same time, lowest ammount for this example is 0.1 lots, but can be modified to 0.01), so we can exit both by tp/sl points, or by losing 1% of our equity or winning 1% of our total equity. It's dinamic.
The strategy is made from
Trend direction :
PSAR
First confirmation point :
Crossover between 10EMA and Bollinger bands middle point
Second confirmation
MACD histogram
Third confirmation
RSI overbought/oversold levels
For entries : we check trend with psar, then once ema cross bb middle point, we confirm together with rsi level for overbought/oversold and macd histogram ( > 0 or <0).
We exit, when we have opposite sign, like from buy to sell or sell to buy, or when we reach tp/sl points, or when we reach % basaed equity points.
It can be changed to be fixed lots, or fixed tp/sl , you just have to uncomment the size from entries, and tp/sl lines.
At the same time, it has the possibility if one desires, to trade only concrete forex session like european, asian and so on for intraday trading.
Hope you enjoy it.
Let me know how it goes.

ATR STRATEGYHere is ATR strategy
Here you will identifie 2 ATR lines
Here is the Intraday Strategy for Indian stockmarket (NSE)
one is higher timeframe and second is for current timeframe chart
Here is the details of all property
////////////// Resolution /////////////
For higher timeframe ATR to compare with current timeframe ATR
Resolution is for higher timeframe ATR
/////////////// MARKET TRADING TIME ////////////////
for intraday time session here
if you want to trade after 10 am than you can modified that and buy sell will start from that
/////////////// MARKET CLOSE TIME //////////////////
for end of intraday trading time put square off intraday position
here timesession selected for close active position
/////////////// MAX LOSS INTRADAY /////////////////
intraday maximum loss
limit your loss in intraday
/////////////// OPTIONAL --- FOR USE STOP-LOSS IN % ---- ///////////////////////
here if you want to fix stop-loss from active position
here input value calculate in percentage(%)
/////////////// OPTIONAL --- FOR USE TARGET IN % ---- ///////////////////////
here if you want to fix target from active position
here input value calculate in percentage(%)
/////////////// TRAIL LONG LOSS % ---- ///////////////////////
for Active Long position put trailing stop-loss
here input value calculate in percentage(%)
/////////////// TRAIL SHORT LOSS % ---- ///////////////////////
for Active Short position put trailing stop-loss
here input value calculate in percentage(%)
///////////////------ Share Qty ---- ///////////////////////
Here your qty to trade
///////////////------ Book Qty ---- ///////////////////////
Here your trading position size you want to book half or full that you will book
///////////////------ ATR ---- ///////////////////////
Here your intraday ATR value that you can change and set as per your requirement
///////////////------ Start Year ---- ///////////////////////
Here strategy result required year from you can set
///////////////------ End Year ---- ///////////////////////
Here strategy result required End year from you can set
///////////////------ Start Month ---- ///////////////////////
Here strategy result required start month from you can set

Trend trader StrategyFirst I would like to thank to @JustUncleL since this strategy started from one of his scalper strategies
This strategy can be adapted to all time charts .
First it has the session where we want to trade, for this example I choosed the EURUSD so I only take in consideration london/neywork session.
Its made from 3 EMA :
normal
slow
ultra slow
It has has the capacity to use HA candles into consideration if its needed.
At the same time we have a price channel made from faster MAs, that act like a bollinger band .
Together with all of them, we establish which trend we have if its uptrend or downtrend
Then we check the candles if they are below or above the MA , and based on the condition if they crossed recently we can suggest if its a buy or a long condition
At the same time we have 2 options of stop conditions:
Through a trailing stop made from ATR or % based
And second, a SL/TP made from pip points or % based.
For this example I used % based.
Let me know what you think about it, and if you found some nice settings for it. So far I only adapted to EURUSD 1 min time.

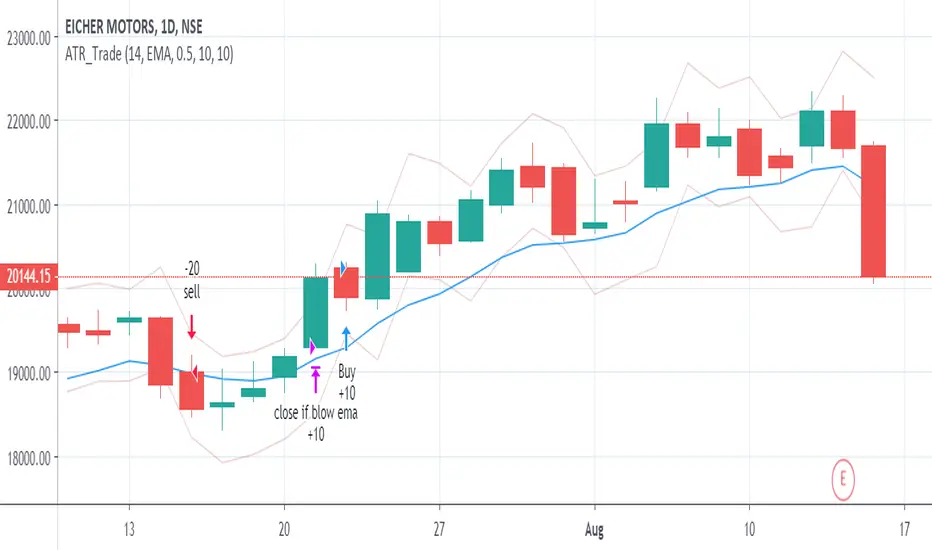
ATR_Trade_strategyATR Based Strategy
Identify the ATR range on Daily Chart.
ATR HIGH= Previous Close +ATR
ATR Low =Previous Close - ATR
Long when Close is above ATR High
Short when Close is below ATR Low
Exit when close moves below EMA(10) OR
a user-selected max loss
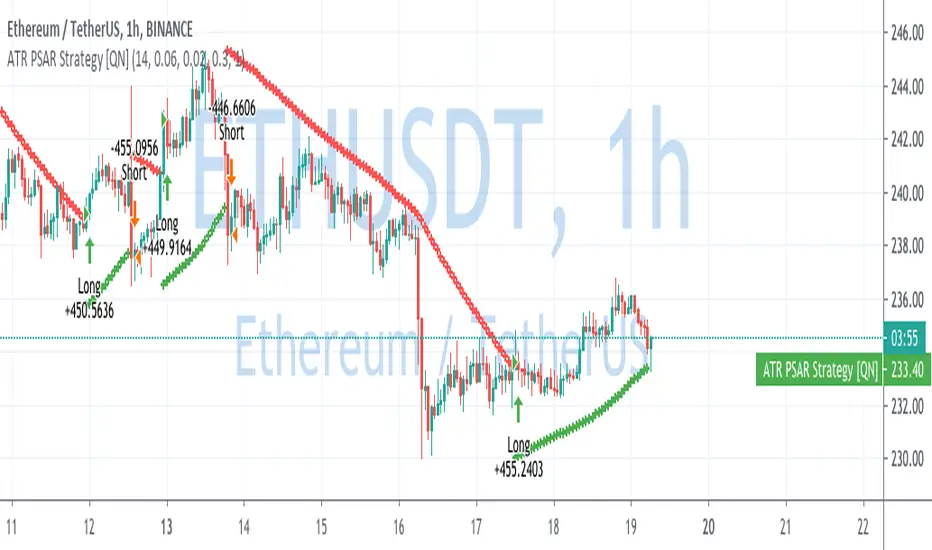
ATR Parabolic SAR Strategy [QuantNomad]I created a version of Parabolic SAR when I accelerate it not based on the difference from the extreme point but based on current ATR. So the idea is that for a more volatile market it should move faster.
Performance is calculated based on 25% equity invested and 0.1% commission.
What do you think about it? Does it make sense to do something like that?
Do you have in mind other ways I can accelerate it when the market starts to be more volatile?
Disclaimer
Please remember that past performance may not be indicative of future results.
Due to various factors, including changing market conditions, the strategy may no longer perform as good as in historical backtesting.
This post and the script don’t provide any financial advice.
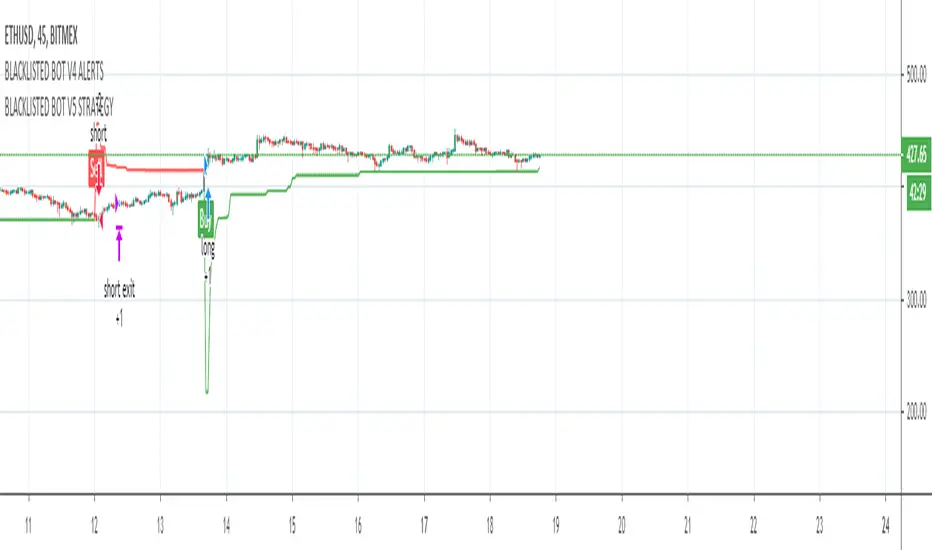
BLACKLISTED BOT V3 STRATEGYStudy used for the Blacklisted Trading Bot
This script uses a variation of ATR and Moving averages giving an alert for a fully automated trading solution.
Fine tuned parameters vary per coin which will be provided for the user after permission is granted.
To gain access to this strategy feel free to contact me directly using a private message.
Support/ Resistance with H1 ATR - strategy mainline versionThis script using ATR (average true range) with source hl2 for create Support/ Resistance line
The color meaning:
- Green = Support line
- Red = Resistance line
Signal:
- If close price breakout Resistance line -> LONG signal will been active.
- If close price breakout Support line -> SHORT signal will been active.
Input setting:
Recommended default setting.
- Factor: amplitude for create Support/ Resistance line.
- Length: length of ATR.
- Offset: number of bar for check sideway or choppy market.
- Take profit: if you want test close position by profit.
- Stop loss: should not be missed.
- Open Position with Stop-Market type:
+ Open LONG position with high price and type Stop-Market.
+ Open SHORT position with low price and type Stop-Market.
Strategy setting:
Recommended default setting if you trade on Binance Futures or change Comission if you trade on another exchange.
Best backtest if:
- Max drawdown less than 10%.
- Min backtest time: 6 month.
- Avg profit: 10%/ month when no leverage is used.
Alert version:
1 - Select create new alert
2 - Condition:
+ eb BUY -> LONG signal
+ eb BUY close -> close LONG position
+ eb SELL -> SHORT signal
+ eb SELL close -> close SHORT position
3 - Option: recommended using only. Because the signal will be more accurate if the price close breakout successfully.
+ Always put stop loss position to avoid PUMP/ DUMP market.
// Note: alert version not free, send for me a private message on TradingView to get price and gain access.
Recommended:
- Using in M30, M45, H1 timeframe with default setting.
- Symbol: BTC
- Exchange: Binance Futures
- Order size: 10% wallet balance, maximum 25% wallet balance.
- Leverage: X2-X5, maximum X10.
---> I using 10% wallet balance and X2 only.

cATRpillar Strategy**This is my first strategy on the Pine editor, any tips or tricks from the community would be awesome!
This strategy was developed from my indicator "cATRpillar". it uses the ATR range values to determine entry, and uses EMA values to determine an exit if the market goes against it.

ATR Trailing Stop advanceHello Traders,
The average true range (ATR) is a technical analysis indicator that measures market volatility . The ATR indicator is easy to use and gives an accurate reading about an ongoing trend that very effective.
I. Signals are used for entry
- Entry your long position (buy) when price crosses above the ATR trailing stop line.
- Entry your short position (sell) when price crosses below the ATR trailing stop line.
II. ATR Trailing Stops Setup
- The ATR period is used to adjust the sensitivity of the ATR trailing stop line. With larger period, the ATR will "smoother" but will signal slower than the price.
- ATR multiplier is a multiple of ATR trailing stop.
- If you want to backtest with trailing take profit, you can tick the box “test with trailing?”. It will affect 2 parameters which are: Trailing point and trailing offset. Where: Trailing Point is the trigger point, the distance from the entry price. Trailing Offset is the take-profit price, which is the distance from the Trailing Point.
III. A few ATR trailing stop configurations, you can use for backtesting:
1. BTC /USDT (M15):
- ATR period: 80
- ATR multiple: 1.91
- Trailing point: 63
- Trailing offset: 10
2. BTC /USDT (M30):
- ATR period: 71
- ATR multiple: 1.63
- Trailing point: 60
- Trailing offset: 10
3. ETH/USDT (M30):
- ATR period: 90
- ATR multiple: 1.81
- Trailing point: 1.12
- Trailing offset: 0.15
4. XRP/USDT (M30):
- ATR period: 125
- ATR multiple: 1.61
- Trailing point: 0.0016
- Trailing offset: 0.0003
IMPORTANT:
Generally, ATR trailing stop still fails in a sideways-moving market. Be Careful and research the strategy before making a buy/sell order.
Hope you enjoy it. We look forward to hearing from you so we can improve this strategy.
Thank you,