Nooner's Heikin-Ashi/Bull-Bear CandlesCandles are colored red and green when Heikin-Ashi and Bull/Bear indicator agree. They are colored yellow when they disagree.
Ashi

Hybrid Heiken AshiThis indicator displays real price candles colored by Heiken Ashi trend direction, giving you the noise reduction benefits of HA without the price distortion.
Key Features:
Real candles with HA-based coloring (see actual price action with trend smoothing)
Gradient coloring based on trend strength (darker = stronger trend)
Optional HA close line overlay
Transition markers when HA flips bullish/bearish
Higher timeframe HA background for multi-timeframe confluence
Optional HA ribbon (HA close vs HA EMA)
Info panel showing current HA status, strength, and HTF alignment
Built-in alerts for HA transitions and timeframe alignment
Use Case:
Ideal for traders who want Heiken Ashi's trend-following benefits without losing sight of real price levels for entries and exits. The strength gradient helps identify conviction moves vs weak trends. HTF background helps avoid counter-trend trades.
Settings:
All visual elements are toggleable. Customize colors, choose your higher timeframe, and enable only the features you need.
XenoSmooth Predictive Candles - Advanced Heikin Ashi CandlesXenoSmooth Predictive Candles
Summary in one paragraph
A synthetic candle engine for crypto, FX, equities, and futures on intraday to swing timeframes. It reduces noise and flip delay so structure is easier to read. The core novelty is a predictive open with inertia plus slope lead fused with a zero lag body filter and an overshoot based wick model normalized by the real range and capped by ATR. Add it to a clean chart, hide regular candles if desired, and tune lengths. Shapes can move while the bar is open and settle on close. For conservative workflows read on bar close.
Scope and intent
• Markets. Major FX pairs, index futures, large cap equities, liquid crypto
• Timeframes. One minute to daily
• Purpose. Faster and smoother visual structure than Heikin Ashi while keeping causality and realistic wicks
Originality and usefulness
• Unique concept. Predictive open with inertia and slope lead plus selectable zero lag body filter and ATR capped wick overshoot in percent of real range
• Failure mode addressed. Late flips in chop and unreal long wicks from raw extremes
• Testability. Every control is an input. Users can toggle body method, lengths, clipping, and percent modeling
• Portable yardstick. ATR based wick cap and percent of bar range scale across symbols
Method overview in plain language
Build a robust base price from O, H, L, and extra weight on Close. Smooth it with a chosen filter to produce the synthetic close. Drive a predictive open that follows the synthetic close with tunable inertia and a small lead from the last bar slope. Model wicks as the portion of the real extremes that extends beyond the synthetic body, smooth that overshoot, normalize by the bar range if selected, then cap by ATR to avoid tail spikes. Clamp synthetic values to the real high and low if enabled.
Base measures
• Range basis. True Range for the ATR cap and High minus Low for percent normalization
• Return basis. Not used
Components
• Body Base Blend. Weighted O H L with a close bias to stabilize the base
• Zero Lag Body Filter. ZLEMA or Super Smoother or WMA to set the synthetic close
• Predictive Open. Inertial follow of the synthetic close plus a slope lead term
• Wick Overshoot Model. Smoothed extension beyond the body, optional percent of real range, ATR cap
• Clamp Option. Keeps synthetic open and close inside the real bar range
Fusion rule
• Synthetic close equals filtered base
• Synthetic open equals previous open plus inertia times distance to synthetic close plus slope lead
• Wicks equal smoothed overshoot above and below the body, optionally percent of range then converted back to price and capped by ATR
Inputs with guidance
Setup
• Signal timeframe. Uses the chart timeframe
• Invert direction. Not applicable
• Session windows. Not applicable
Logic
• Body length. Core smoothing length for the synthetic close. Typical 6 to 14. Higher gives smoother and slower. Lower gives faster flips
• Body method. ZLEMA or Super Smoother or WMA. ZLEMA is fastest. Super Smoother is calmest
• Close weight in base. 0 to 1. Higher gives stronger emphasis on close and less noise
• Open inertia. 0 to 1. Higher makes the open follow the close more tightly
• Lead gain. 0 to 1. Higher adds more phase lead. Keep modest to avoid overshoot
• Clamp body to real range. On keeps synthetic body inside high and low
• Wick smooth length. Typical 4 to 10. Higher reduces jitter
• Overshoot as percent. On stabilizes wicks across regimes
• ATR length. Typical 10 to 20 for the cap
• Max wick equals ATR times. 0 disables. 1.0 to 2.0 contains extreme tails
Filters
• Efficiency or trend filter. Not used
• Micro versus macro range relation. Not used
• Location filter. Not used
Realism and responsible publication
• No performance claims
• Intrabar motion reminder. Shapes can move while a bar forms and settle on close
• Strategies must use standard candles for signals and orders
Honest limitations and failure modes
• High impact releases and thin liquidity can distort wicks and produce gaps that any smoother cannot predict
• Very quiet regimes can reduce contrast. Consider longer body length
• Session time on the chart controls the definition of each bar

Adaptive Heikin Ashi [CHE]Adaptive Heikin Ashi — volatility-aware HA with fewer fake flips
Summary
Adaptive Heikin Ashi is a volatility-aware reinterpretation of classic Heikin Ashi that continuously adjusts its internal smoothing based on the current ATR regime, which means that in quiet markets the indicator reacts more quickly to genuine directional changes, while in turbulent phases it deliberately increases its smoothing to suppress jitter and color whipsaws, thereby reducing “noise” and cutting down on fake flips without resorting to heavy fixed smoothing that would lag everywhere.
Motivation: why adapt at all?
Classic Heikin Ashi replaces raw OHLC candles with a smoothed construction that averages price and blends each new candle with the previous HA state, which typically cleans up trends and improves visual coherence, yet its fixed smoothing amount treats calm and violent markets the same, leading to the usual dilemma where a setting that looks crisp in a narrow range becomes too nervous in a spike, and a setting that tames high volatility feels unnecessarily sluggish as soon as conditions normalize; by allowing the smoothing weight to expand and contract with volatility, Adaptive HA aims to keep candles readable across shifting regimes without constant manual retuning.
What is different from normal Heikin Ashi?
Fixed vs. adaptive blend:
Classic HA implicitly uses a fixed 50/50 blend for the open update (`HA_open_t = 0.5 HA_open_{t-1} + 0.5 HA_close_{t-1}`), while this script replaces the constant 0.5 with a dynamic weight `w_t` that oscillates around 0.5 as a function of observed volatility, which turns the open update into an EMA-like filter whose “alpha” automatically changes with market conditions.
Volatility as the steering signal:
The script measures volatility via ATR and compares it to a rolling baseline (SMA of ATR over the same length), producing a normalized deviation that is scaled by sensitivity, clamped to ±1 for stability, and then mapped to a bounded weight interval ` `, so the adaptation is strong enough to matter but never runs away.
Outcome that matters to traders:
In high volatility, the weight shifts upward toward the prior HA open, which strengthens smoothing exactly where classic HA tends to “chatter,” while in low volatility the weight shifts downward toward the most recent HA close, which speeds up reaction so quiet trends do not feel artificially delayed; this is the practical mechanism by which noise and fake signals are reduced without accepting blanket lag.
How it works
1. HA close matches classic HA:
`HA_close_t = (Open_t + High_t + Low_t + Close_t) / 4`
2. Volatility normalization:
`ATR_t` is computed over `atr_length`, its baseline is `ATR_SMA_t = SMA(ATR, atr_length)`, and the raw deviation is `(ATR_t / ATR_SMA_t − 1)`, which is then scaled by `adapt_sensitivity` and clamped to ` ` to obtain `v_t`, ensuring that pathological spikes cannot destabilize the weighting.
3. Adaptive weight around 0.5:
`w_t = 0.5 + oscillation_range v_t`, giving `w_t ∈ `, so with a default `range = 0.20` the weight stays between 0.30 and 0.70, which is wide enough to matter but narrow enough to preserve HA identity.
4. EMA-like open update:
On the very first bar the open is seeded from a stable combination of the raw open and close, and thereafter the update is
`HA_open_t = w_t HA_open_{t−1} + (1 − w_t) HA_close_{t−1}`,
which is equivalent to an EMA where higher `w_t` means heavier inertia (more smoothing) and lower `w_t` means stronger pull to the latest price information (more responsiveness).
5. High and low follow classic HA composition:
`HA_high_t = max(High_t, max(HA_open_t, HA_close_t))`,
`HA_low_t = min(Low_t, min(HA_open_t, HA_close_t))`,
thereby keeping visual semantics consistent with standard HA so that your existing reading of bodies, wicks, and transitions still applies.
Why this reduces noise and fake signals in practice
Fake flips in HA typically occur when a fixed blending rule is forced to process candles during a volatility surge, producing rapid alternations around pivots or within wide intrabar ranges; by increasing smoothing exactly when ATR jumps relative to its baseline, the adaptive open stabilizes the candle body progression and suppresses transient color changes, while in the opposite scenario of compressed ranges, the reduced smoothing allows small but persistent directional pressure to reflect in candle color earlier, which reduces the tendency to enter late after multiple slow transitions.
Parameter guide (what each input really does)
ATR Length (default 14): controls both the ATR and its baseline window, where longer values dampen the adaptation by making the baseline slower and the deviation smaller, which is helpful for noisy lower timeframes, while shorter values make the regime detector more reactive.
Oscillation Range (default 0.20): sets the maximum distance from 0.5 that the weight may travel, so increasing it towards 0.25–0.30 yields stronger smoothing in turbulence and faster response in calm periods, whereas decreasing it to 0.10–0.15 keeps the behavior closer to classical HA and is useful if your strategy already includes heavy downstream smoothing.
Adapt Sensitivity (default 6.0): multiplies the normalized ATR deviation before clamping, such that higher sensitivity accelerates adaptation to regime shifts, while lower sensitivity produces gradual transitions; negative values intentionally invert the mapping (higher vol → less smoothing) and are generally not recommended unless you are testing a counter-intuitive hypothesis.
Reading the candles and the optional diagnostic
You interpret colors and bodies just like with normal HA, but you can additionally enable the Adaptive Weight diagnostic plot to see the regime in real time, where values drifting up toward the upper bound indicate a turbulent context that is being deliberately smoothed, and values gliding down toward the lower bound indicate a calm environment in which the indicator chooses to move faster, which can be valuable for discretionary confirmation when deciding whether a fresh color shift is likely to stick.
Practical workflows and combinations
Trend-following entries: use color continuity and body expansion as usual, but expect fewer spurious alternations around news spikes or into liquidity gaps; pairing with structure (swing highs/lows, breaks of internal ranges) keeps entries disciplined.
Exit management: when the diagnostic weight remains elevated for an extended period, you can be stricter with exit triggers because flips are less likely to be accidental noise; conversely, when the weight is depressed, consider earlier partials since the indicator is intentionally more nimble.
Multi-asset, multi-TF: the adaptation is especially helpful if you rotate instruments with very different vol profiles or hop across timeframes, since you will not need to retune a fixed smoothing parameter every time conditions change.
Behavior, constraints, and performance
The script does not repaint historical bars and uses only past information on closed candles, yet just like any candle-based visualization the current live bar will update until it closes, so you should avoid acting on mid-bar flips without a rule that accounts for bar close; there are no `security()` calls or higher-timeframe lookups, which keeps performance light and execution deterministic, and the clamping of the volatility signal ensures numerical stability even during extreme ATR spikes.
Sensible defaults and quick tuning
Start with the defaults (`ATR 14`, `Range 0.20`, `Sensitivity 6.0`) and observe the weight plot across a few volatile events; if you still see too many flips in turbulence, either raise `Range` to 0.25 or trim `Sensitivity` to 4–5 so that the weight can move high but does not overreact, and if the indicator feels too slow in quiet markets, lower `Range` toward 0.15 or raise `Sensitivity` to 7–8 to bias the weight a bit more aggressively downward when conditions compress.
What this indicator is—and is not
Adaptive Heikin Ashi is a context-aware visualization layer that improves the signal-to-noise ratio and reduces fake flips by modulating smoothing with volatility, but it is not a complete trading system, it does not predict the future, and it should be combined with structure, risk controls, and position management that fit your market and timeframe; always forward-test on your instruments, and remember that even adaptive smoothing can delay recognition at sharp turning points when volatility remains elevated.
Disclaimer
The content provided, including all code and materials, is strictly for educational and informational purposes only. It is not intended as, and should not be interpreted as, financial advice, a recommendation to buy or sell any financial instrument, or an offer of any financial product or service. All strategies, tools, and examples discussed are provided for illustrative purposes to demonstrate coding techniques and the functionality of Pine Script within a trading context.
Any results from strategies or tools provided are hypothetical, and past performance is not indicative of future results. Trading and investing involve high risk, including the potential loss of principal, and may not be suitable for all individuals. Before making any trading decisions, please consult with a qualified financial professional to understand the risks involved.
By using this script, you acknowledge and agree that any trading decisions are made solely at your discretion and risk.
Best regards and happy trading
Chervolino

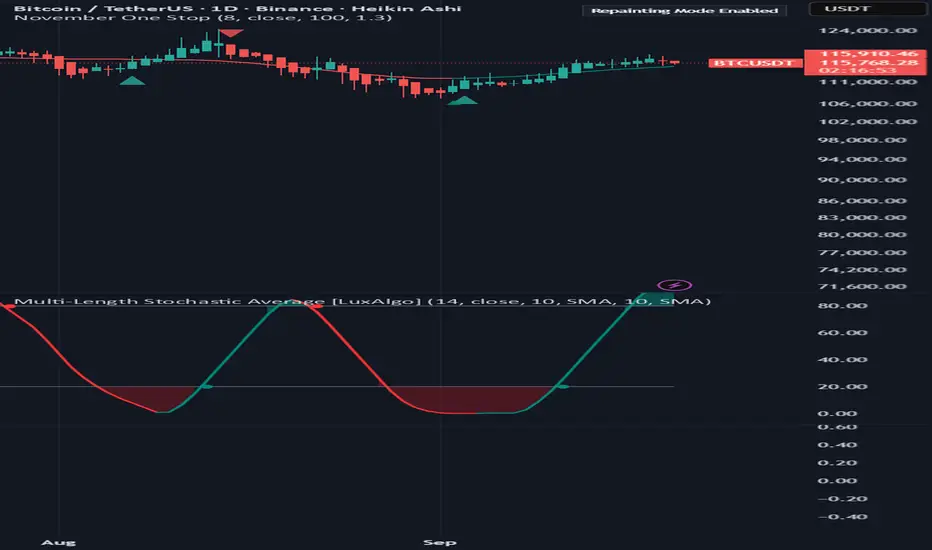
November One StopNovember One Stop
This script is designed to confirm entry confidence in trend trading using Heiken Ashi candles, with an optional enhancement through a multi-strength RSI indicator.
Confidence Levels:
Level 3 (Strong Confidence):
Entry is confirmed when three consecutive Heiken Ashi candles of the same color appear (green for long positions, red for short positions).
Additional confirmation is provided when the arrow indicator, the moving average line, and the closing candle are all aligned in color, indicating a strong trend with minimal likelihood of immediate reversal.
Level 4 (Maximum Confidence):
Incorporating a multi-strength RSI as an additional filter provides a fourth level of confirmation. While this may result in missing some initial gains, it significantly reduces risk by ensuring all indicators are in agreement. This script does not yet incorporate the RSI.
Entry Criteria:
Wait for three consecutive Heiken Ashi candles of the same color.
Confirm that the arrow indicator, moving average line, and the closing candle are all aligned in color.
For maximum confidence, ensure the multi-strength RSI also confirms the trend direction.
Risk Consideration:
Entering before all indicators are aligned increases risk due to potential reversals. Alignment of all indicators provides higher probability of trend continuation for the selected timeframe.
Recommendation:
Before implementation, review historical performance of this strategy to gain a comprehensive understanding of its effectiveness.
Roadmap for improvements:
Include RSI
Improve Alarm trigger options
Wickless Heikin Ashi B/S [CHE]Wickless Heikin Ashi B/S \
Purpose.
Wickless Heikin Ashi B/S \ is built to surface only the cleanest momentum turns: it prints a Buy (B) when a bullish Heikin-Ashi candle forms with virtually no lower wick, and a Sell (S) when a bearish Heikin-Ashi candle forms with no upper wick. Optional Lock mode turns these into one-shot signals that hold the regime (bull or bear) until the opposite side appears. The tool can also project dashed horizontal lines from each signal’s price level to help you manage entries, stops, and partial take-profits visually.
How it works.
The indicator computes standard Heikin-Ashi values from your chart’s OHLC. A bar qualifies as bullish if its HA close is at or above its HA open; bearish if below. Then the wick on the relevant side is compared to the bar’s HA range. If that wick is smaller than your selected percentage threshold (plus a tiny tick epsilon to avoid rounding noise), the raw condition is considered “wickless.” Only one side can fire; on the rare occasion both raw conditions would overlap, the bar is ignored to prevent false dual triggers. When Lock is enabled, the first valid signal sets the active regime (background shaded light green for bull, light red for bear) and suppresses further same-side triggers until the opposite side appears, which helps reduce overtrading in chop.
Why wickless?
A missing wick on the “wrong” side of a Heikin-Ashi candle is a strong hint of persistent directional pressure. In practice, this filters out hesitation bars and many mid-bar flips. Traders who prefer entering only when momentum is decisive will find wickless bars useful for timing entries within an established bias.
Visuals you get.
When a valid buy appears, a small triangle “B” is plotted below the bar and a green dashed line can extend to the right from the signal’s HA open price. For sells, a triangle “S” above the bar and a red dashed line do the same. These lines act like immediate, price-anchored references for stop placement and profit scaling; you can shift the anchor left by a chosen number of bars if you prefer the line to start a little earlier for visual alignment.
How to trade it
Establish context first.
Pick a timeframe that matches your style: intraday index or crypto traders often use 5–60 minutes; swing traders might prefer 2–4 hours or daily. The tool is agnostic, but the cleanest results occur when the market is already trending or attempting a fresh breakout.
Entry.
When a B prints, the simplest rule is to enter long at or just after bar close. A conservative variation is to require price to take out the high of the signal bar in the next bar(s). For S, invert the logic: enter short on or after close, or only if price breaks the signal bar’s low.
Stop-loss.
Place the stop beyond the opposite extreme of the signal HA bar (for B: under the HA low; for S: above the HA high). If you prefer a static reference, use the dashed line level (signal HA open) or an ATR buffer (e.g., 1.0–1.5× ATR(14)). The goal is to give the trade enough room that normal noise does not immediately knock you out, while staying small enough to keep the risk contained.
Take-profit and management.
Two pragmatic approaches work well:
R-multiple scaling. Define your initial risk (distance from entry to stop). Scale out at 1R, 2R, and let a runner go toward 3R+ if structure holds.
Trailing logic. Trail behind a short moving average (e.g., EMA 20) or progressive swing points. Many traders also exit on the opposite signal when Lock flips, especially on faster timeframes.
Position sizing.
Keep risk per trade modest and consistent (e.g., 0.25–1% of account). The indicator improves timing; it does not replace risk control.
Settings guidance
Max lower wick for Bull (%) / Max upper wick for Bear (%).
These control how strict “wickless” must be. Tighter values (0.3–1.0%) yield fewer but cleaner signals and are great for strong trends or low-noise instruments. Looser values (1.5–3.0%) catch more setups in volatile markets but admit more noise. If you notice too many borderline bars triggering during high-volatility sessions, increase these thresholds slightly.
Lock (one-shot until opposite).
Keep Lock ON when you want one decisive signal per leg, reducing noise and signal clusters. Turn it OFF only if your plan intentionally scales into trends with multiple entries.
Extended lines & anchor offset.
Leave lines ON to maintain a visual memory of the last trigger levels. These often behave like near-term support/resistance. The offset simply lets you start that line one or more bars earlier if you prefer the look; it does not change the math.
Colors.
Use distinct bull/bear line colors you can read easily on your theme. The default lime/red scheme is chosen for clarity.
Practical examples
Momentum continuation (long).
Price is above your baseline (e.g., EMA 200). A B prints with a tight lower wick filter. Enter on close; stop under the signal HA low. Price pushes up in the next bars; you scale at 1R, trail the rest with EMA 20, and finally exit when a distant S appears or your trail is hit.
Breakout confirmation (short).
Following a range, price breaks down and prints an S with no upper wick. Enter short as the bar closes or on a subsequent break of the signal bar’s low. If the next bar immediately rejects and prints a bullish HA bar, your stop above the signal HA high limits damage. Otherwise, ride the move, harvesting partials as the red dashed line remains unviolated.
Alerts and automation
Set alerts to “Once Per Bar Close” for stability.
Bull ONE-SHOT fires when a valid buy prints (and Lock allows it).
Bear ONE-SHOT fires for sells analogously.
With Lock enabled, you avoid multiple pings in the same direction during a single leg—useful for webhooks or mobile notifications.
Reliability and limitations
The script calculates from completed bars and does not use higher-timeframe look-ahead or repainting tricks. Heikin-Ashi smoothing can lag turns slightly, which is expected and part of the design. In narrow ranges or whipsaw conditions, signals naturally thin out; if you must trade ranges, either tighten the wick filters and keep Lock ON, or add a trend/volatility filter (e.g., trade B only above EMA 200; S only below). Remember: this is an indicator, not a strategy. If you want exact statistics, port the triggers into a strategy and backtest with your chosen entry, stop, and exit rules.
Final notes
Wickless Heikin Ashi B/S \ is a precision timing tool: it waits for decisive, wickless HA bars, provides optional regime locking to reduce noise, and leaves clear price anchors on your chart for disciplined management. Use it with a simple framework—trend bias, fixed risk, and a straightforward exit plan—and it will keep your execution consistent without cluttering the screen or your decision-making.
Disclaimer: This indicator is for educational use and trade assistance only. It is not financial advice. You alone are responsible for your risk and results.
Enhance your trading precision and confidence with Wickless Heikin Ashi B/S ! 🚀
Happy trading
Chervolino

CNS - RSI CandlesPlots RSI candles instead of a line, although user still has option to use line type RSI.
My version corrects inconsistencies I have found in all the other available RSI candle indicators and should be more accurate.
Both options allow use of fast and slow double EMAs for crossover strategies.
User also has the option to apply Heikin-Ashi smoothing to the RSI candles without having to use Heikin-Ashi candles on the main price chart for the underlying ticker.

Heikin Ashi VolumeHeikin Ashi candles decrease market noise so that broader trends can be more easily visualized. In a typical chart utilizing Heikin Ashi candles, volume bars are colored in such a way that they also allow for the visualization of trends during a bullish/bearish move.
The Heikin Ashi Volume indicator allows the trader to continue to use the same volume bar coloring technique to visualize trends without having to utilize the Heikin Ashi candles, since a Heikin Ashi candle’s OHLC values are not true prices but instead based on calculations in order to provide the ‘denoising’ effect they are known for.
In addition to providing the Heikin Ashi Volume coloring effects, the Heikin Ashi Volume indicator also allows the user to set a volume threshold level where the bar colors will be darker unless volume is beyond that threshold, helping traders quickly determine if there is enough participation in the market at that time to justify taking risk in a trade when the market isn’t very active. The user has the option to show or hide the threshold line, change the colors of the bullish/bearish colors (for both above and below threshold volumes) and the option for the indicator to gradually brighten the bar colors are they approach the threshold instead of having a clear line of demarcation showing volume above or below the set threshold.

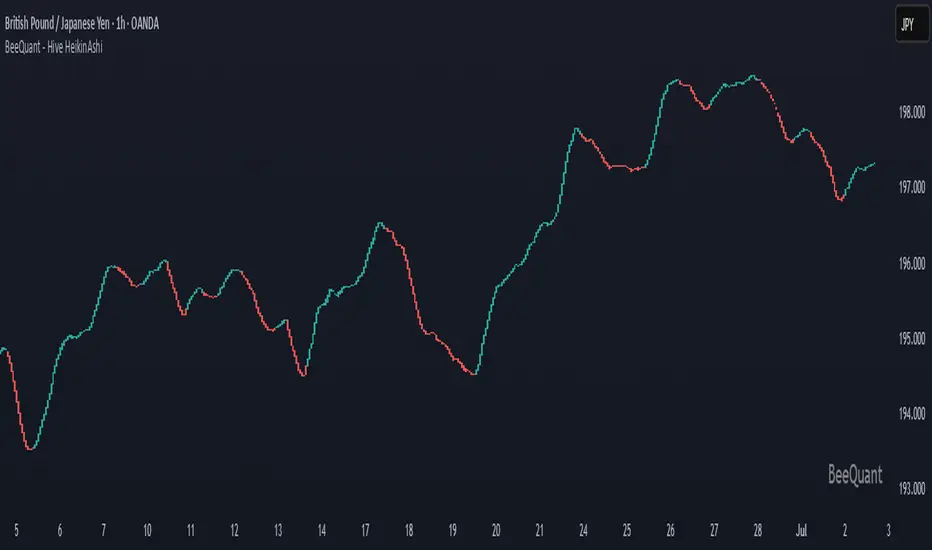
BeeQuant - Hive HeikinAshi💠 OVERVIEW
The "Hive HeikinAshi" is your ultimate tool for simplifying the chaotic world of price charts. Imagine a specialized lens that cuts through all the market "noise" – those tiny, confusing movements – and reveals the clear, underlying current of price action. This indicator transforms standard, sometimes choppy, candlestick charts into a powerful, trend-focused visualization. It’s designed to help every trader, whether you're a discretionary trader seeking cleaner structures or a quant enthusiast looking for visual cues to complement models, Hive HeikinAshi provides a simplified yet highly informative lens through which to read price action.
Its main advantage lies in its seamless compatibility with external indicators — offering a next-level smoothing foundation that enhances the clarity and reliability of any existing trend, momentum, or signal-based system layered on top of it.
__________________________________________________________________________
🧠 CONCEPTS
At its core, the "Hive HeikinAshi" isn't just another way to look at candles; it's a profound re-interpretation of price dynamics. It employs a sophisticated internal process to distill raw market movements into a more coherent, trend-identifying display, making the market's story incredibly easy to read.
The "Hive" Transformation: Unlike traditional candlesticks that show every small price fluctuation, the "Hive HeikinAshi" candles are intelligently constructed to smooth out the data. They are derived from a multi-point calculation process, creating a new, more consistent visual representation of price. This transformation helps to reduce the "visual clutter" and make trend following a much more intuitive experience. You'll see the forest, not just the trees.
⬜ Highlights dominant price direction by filtering reactive fluctuations
⬜ Visually separates impulsive vs corrective behavior with clear color transitions
⬜ Enables quicker discretionary recognition of trend shifts without complex overlays
⬜ Ideal for confirming momentum zones and stable trending phases
⬜ The Intelligent Filter. An optional yet powerful "Filter" mechanism has been integrated, providing an additional layer of analytical discernment.
⬜ Designed to integrate natively with trend-following, oscillator, or signal indicators — enabling amplified precision across diverse trading systems
A significant advantage of the "Hive HeikinAshi" is its inherent ability to minimize distracting "noise" from typical candle wicks. While standard candles can often show long, confusing wicks that obscure the true body direction, our specialized candles are engineered to emphasize the core directional move. This intelligent design allows you to focus on the momentum generated by the candle's body, rather than getting sidetracked by fleeting price extremes, thereby providing a cleaner, more reliable visual of trend strength.
__________________________________________________________________________
✨ FEATURES
Hive HeikinAshi includes several key features designed for both clarity and functionality:
🔹Multi-Bar Averaging
Generates a visually balanced candle structure using averaged pricing across configurable recent bars.
🔹 Wickless Visualization
Candles are rendered without upper/lower shadows, enhancing trend detection and reducing signal confusion.
🔹 Signal Filter
Adaptive color filter using a dynamic high/low lookback logic
🔹 Directional Color Coding
Clean green/red coloring helps instantly interpret bullish or bearish pressure.
🔹 Adjustable History Depth
Customize how many bars are considered in the smoothing process to match your style and timeframe.
🔹 Invisible Price Feed Outputs
Underlying smoothed OHLC values are available for custom strategies or overlays.
🔹Non-Repainting Logic for Historical Reliability
Each "Hive HeikinAshi" is plotted only when its internal reconstruction conditions are fully met and confirmed. This ensures that the historical display of HeikinAshi does not repaint, providing a high degree of reliability and trust in past signals and visualizations.
🔹Cross-Market Versatility
This indicator is engineered to perform with precision across all major markets—whether you're trading forex, commodities, stocks, or indices. Its adaptive logic automatically aligns with the unique volatility and structure of each asset class, delivering consistently reliable insights no matter where you trade.
__________________________________________________________________________
⚙️ USAGE
Using Hive HeikinAshi is simple and effective:
📥 Add to Chart
Once access is granted, apply the indicator to any timeframe or asset directly from your TradingView invite-only indicators list.
⚙️ Tweak “No. of Bars”
This setting controls how far back the smoothing engine looks.
• Lower values = more responsive, shorter-term smoothing
• Higher values = steadier candles, better for macro trends
🎚️ Next, consider the "Filter" option:
Turn this on to activate the advanced filtering mechanism. Then, adjust the "lookback bars" (from 1 to 10). A smaller number here will make the filter more responsive to immediate "Hive HeikinAshi" candle extremes, while a larger number will require a more sustained breakout from the recent filtered range. Experiment to discover the optimal "sweet spot" that best reveals the underlying market flow for your specific strategy. The tooltip guides you to this optimal setting.
Disable "Filter": If turned off, the candles will revert to a more direct HeikinAshi coloration based purely on their calculated open and close, without the additional layer of range filtering.
🔍 Interpreting Candles
• 🟢 Green Candle: Bullish continuation zone
• 🔴 Red Candle: Bearish pressure dominates
• Lack of wick = strong directional conviction
Combine with your favorite indicators — Hive HeikinAshi acts as a foundation to reduce noise and enhance clarity across tools like EMAs, MACD, VWAP, and more.
__________________________________________________________________________
⚠️ LIMITATIONS
While Hive HeikinAshi provides clear visual advantages, it is important to understand its scope:
👉 Not a Signal Generator: This indicator excels at identifying and confirming trends, making it less suitable for pinpointing exact, high-frequency entry and exit points that require unadulterated real-time price. It prioritizes overall directional clarity.
👉 Lag by Design: Due to multi-bar data smoothing, candles reflect stable price behavior but not ultra-short-term fluctuations.
👉 No Volume or Macro Inputs: Hive HeikinAshi focuses purely on price structure — it does not include volume, news, or external conditions.
👉 Filter Calibration: While the "Filter" enhances clarity, its effectiveness is dependent on appropriate "lookback bars" calibration. Users should understand that adding filtering inherently balances responsiveness with a more refined signal, and finding the optimal setting is part of the analytical process.
█ ▒▒▒▒▒▒▒▒▒▒▒▒▒▒▒▒▒▒▒▒▒▒▒ 『•••• ✎ ••••』 ▒▒▒▒▒▒▒▒▒▒▒▒▒▒▒▒▒▒▒▒▒▒▒▒ █
🎯 CONCLUSION
Hive HeikinAshi is a powerful visual companion for modern traders seeking smoother, clearer price trends. By combining directional clarity with reduced chart clutter, it allows you to interpret the market with less noise and more confidence. Seamlessly integrate this advanced visual tool within your analytical framework to gain a sharper, more confident perspective, and elevate your strategic decision-making in the markets. It's about seeing the unseen, with clarity.
▣▣▣▣▣▣▣▣▣▣▣▣▣▣▣▣▣▣▣▣▣▣▣▣▣▣▣▣▣▣▣▣▣▣▣▣▣▣▣▣▣▣▣▣▣▣▣▣▣▣▣
🚨 RISK DISCLAIMER
Engagement in financial market speculation inherently carries a substantial degree of inherent risk, and the potential for capital diminution, potentially exceeding initial deposits, is a pervasive and non-trivial consideration. All content, algorithmic tools, scripts, articles, and educational materials disseminated by "Hive HeikinAshi" are exclusively purposed for informational and pedagogical objectives, strictly for reference. Historical performance data, whether explicitly demonstrated or implicitly suggested, offers no infallible assurance or guarantee of future outcomes. Users bear sole and ultimate accountability for their individual trading decisions and are emphatically urged to meticulously assess their financial disposition, risk tolerance parameters, and conduct independent due diligence prior to engaging in any speculative market activity.
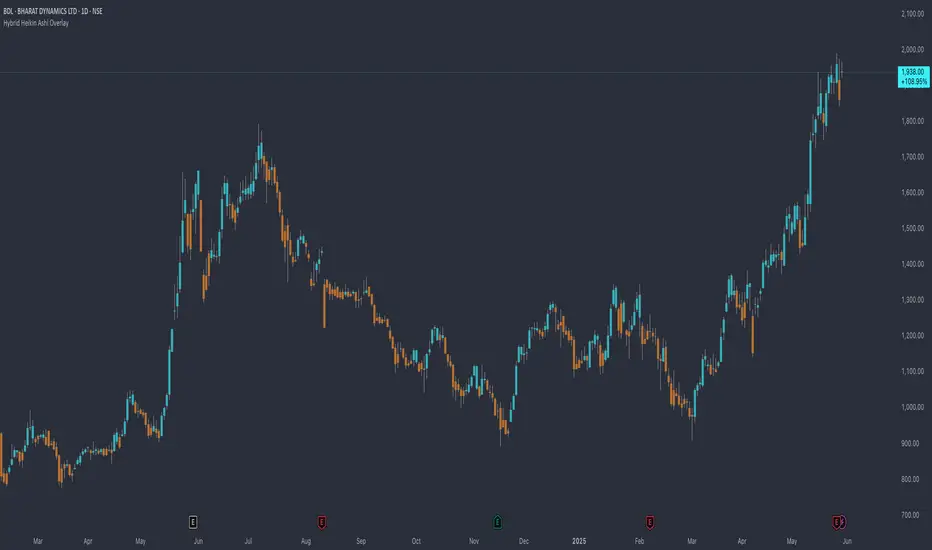
Hybrid Heikin Ashi OverlayHybrid Heikin Ashi Overlay
I personally like Heikin Ashi for its simplicity in showing clean trends. However, it tends to smooth out price action so much that we sometimes miss key signals from the actual candles.
This indicator overlays Heikin Ashi-style background colors while keeping regular candles intact — giving you the best of both worlds:
• Smoother trend visibility
• No loss of execution precision
• Customizable colors & transparency
🔹 No repainting
🔹 No strategy logic — purely visual
🔹 Designed to reduce clutter and help traders stay focused on structure
Created by: @yug_and_her
HALC SYHALC SY @CK
Heikin Ashi Last Candle shows color of the last closed 30m heikin ashi candle for every new candle on your graph indicating local trend for scalp & short term trading in rder to help u choose right direction in your 1-5m tf trading. Non-repainting & designed for use on any graph type incl HA, Renko and other problematic syntetic as well as any of your own.
Dont recommend as entry signal but strong support to confirm/deny your trade system entry signal. Enjoy!

Heikin-Ashi Reversals with Region & DotsIf you want to use Heiken Ashi candles as a way to screen for bullish and bearish reversal.
Green background is stay long and strong. Red background = potential top or bearish continuation.
Yellow dots show strong red heiken ashi candles with small upside wicks. The next candle determines whether it should be green or red. If next heiken ashi candle closes above the current candle = green, bull trend still in line. If next heiken ashi candle closes below, then time to sell

Heikin-Ashi Trend ScalpHeikin-Ashi Trend Scalp is an indicator for TradingView, designed to identify short-term trends and entry points based on Heikin-Ashi candles and EMA crossovers.
Key Features:
Attention Signals: Early warning of potential entry points.
Buy/Sell Signals: Filtered signals based on the prevailing trend.
Filters (Slow Mode, Shadow Filter): Help reduce the number of false signals.
Shadow Filter: Eliminates false signals caused by shadows against the trend.
The warning bar should not have any shadow against the trend.
If the bar with the buy/sell signal has a shadow that crosses the opening level of the warning bar, the signal disappears.
Since the signal may disappear as the candle forms, entries should only be made after the signal has been confirmed.
It is not recommended to disable the Shadow Filter, as doing so may lead to an increase in false signals.
Slow Mode: Reduces false signals by using longer-term EMA crossovers. For timeframes of 1–5 minutes, it is recommended to use Slow Mode to reduce false signals.
EMA Lines (7, 21, 50): Displayed for trend determination. Depending on the selected mode: in standard mode, EMA 21 (fast) is shown, in Slow Mode, the longer-term EMA 50 (slow) is displayed.
Stop-Loss Price: Automatically set at the opening level of the candle two bars ago and displayed on the chart.
RSI: Displays the current value of the RSI indicator and visualizes it with color:
Red — for overbought conditions (above 70).
Green — for oversold conditions (below 30).
Yellow — for values in the neutral zone (between 30 and 70).
Alerts: Notifications for new signals in real-time.
The indicator is ideal for scalping and short-term trading, especially when used in conjunction with other technical analysis tools.

3 Heiken Ashi# Heiken Ashi Overlay Indicator
This custom indicator overlays the last three Heiken Ashi candles on your regular candlestick chart, providing traders with immediate trend direction insights without switching between chart types.
## Key Features
- **Real-time Overlay**: Displays three most recent Heiken Ashi candles on the right side of your chart
- **Color Coding**: Green candles indicate upward momentum, red candles show downward momentum
- **Timeframe Adaptive**: Maintains consistent display across all timeframes
- **Clean Visualization**: Clear separation between regular candlesticks and Heiken Ashi overlay
## Trading Applications
**Trend Confirmation**
- Green Heiken Ashi candles suggest strengthening bullish momentum
- Red Heiken Ashi candles indicate developing bearish pressure
- The sequence of colors helps identify potential trend reversals
**Decision Making Benefits**
- Quick trend assessment without chart switching
- Enhanced signal confirmation
- Reduced noise in trend identification
- Improved entry and exit timing
## Technical Details
The indicator uses standard Heiken Ashi calculations:
- HA Close = (Open + High + Low + Close)/4
- HA Open = Previous HA (Open + Close)/2
- HA High = Maximum(High, HA Open, HA Close)
- HA Low = Minimum(Low, HA Open, HA Close)
## Usage Tips
1. Use alongside your regular technical analysis
2. Watch for color changes as early trend reversal signals
3. Consider the size of Heiken Ashi candles for momentum strength
4. Compare with price action on the main chart for confirmation
This overlay combines the smoothing benefits of Heiken Ashi with the precision of regular candlesticks, offering traders a powerful tool for trend analysis and decision-making.
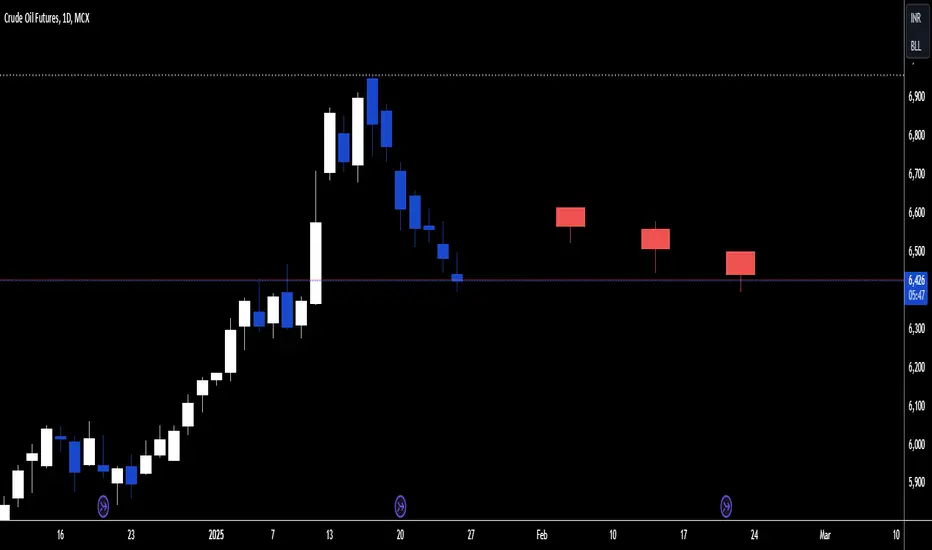
SuperTrend Heikin AshiSupertrend Heikin Ashi is an indicator based on the standard calculation of the Supertrend with the difference of using the Open and Close value of the Heikin Ashi candles instead of the normal Candle Sticks.
In this way the main characteristic of the HA candles is exploited, thus filtering movements that could generate false signals.
I recommend using SPY, SPX, QQQ to be aware of the market situation, not operating (or paying great attention) long on stocks when the indicator is red and the price is below the drawn line.

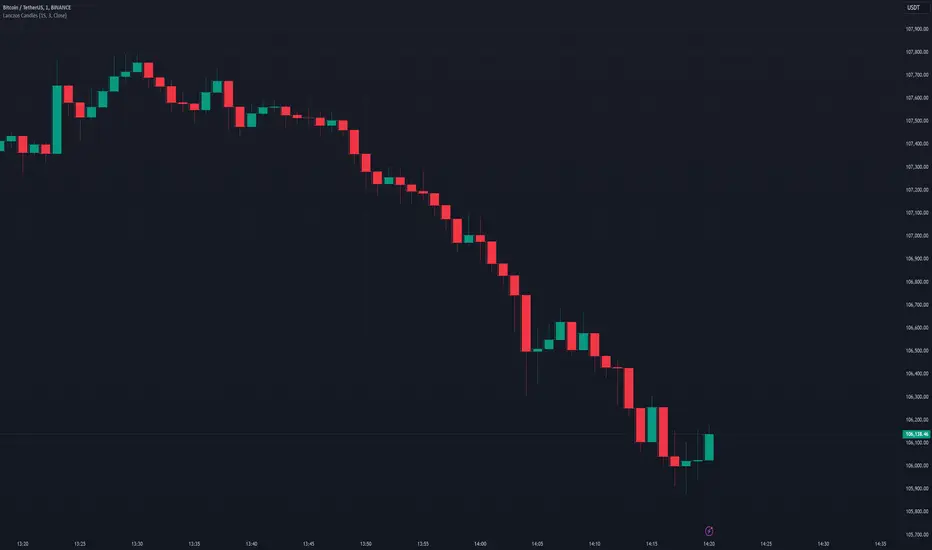
Lanczos CandlesThis indicator reconstructs price action using Lanczos resampling, incorporating lower timeframe data to create a more detailed representation of market movements. Traditional candle aggregation on higher timeframes tends to lose some price action detail - this indicator attempts to preserve more of that information through mathematical resampling.
The indicator samples price data from a lower timeframe and uses the Lanczos algorithm, a mathematical method commonly used in signal processing and image resampling, to reconstruct the price series at the chart's timeframe. The process helps maintain price movements that might otherwise be smoothed out in regular candle aggregation.
The main settings allow you to select the source timeframe for sampling, adjust the Lanczos filter width to balance smoothness versus detail preservation, and optionally enable Heikin Ashi calculation. The filter width parameter (default: 3) affects how aggressive the smoothing is - higher values produce smoother results while lower values retain more of the original variation.
This approach can be useful for technical analysis when you want to work with higher timeframes while maintaining awareness of significant price movements that occurred within those candles. The optional Heikin Ashi mode can help visualize trends in the resampled data.
The indicator works best when there's a clear ratio between your chart timeframe and the source timeframe (for example, using 1-minute data to build 5-minute candles).
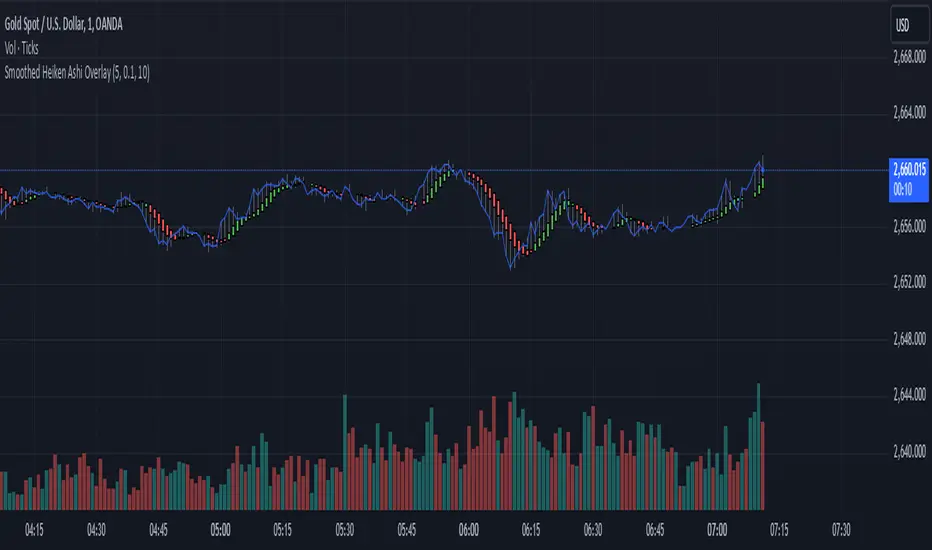
Smoothed Heiken Ashi Trend FilterThis indicator applies the Heiken Ashi technique with added smoothing and trend filtering to help reduce noise and improve trend detection.
Components of the Indicator:
Heiken Ashi Calculations:
Heiken Ashi Close (ha_close): This is the smoothed average of the current bar’s open, high, low, and close prices, calculated with a simple moving average (SMA) to filter out noise.
Heiken Ashi Open (ha_open): This is the average of the previous Heiken Ashi Open and the current Heiken Ashi Close. It’s also initialized to smooth the transition on the first bar.
Heiken Ashi High (ha_high) and Low (ha_low): These values are calculated as the highest and lowest values among the high, Heiken Ashi Open, and Heiken Ashi Close for each bar.
Smoothing and Noise Reduction:
Smoothing Length: The indicator applies a smoothing length to the Heiken Ashi Close, calculated with an SMA. This reduces minor fluctuations, giving a clearer view of the price action.
Minimum Body Size Filter: This filter calculates the body size of each Heiken Ashi candle and compares it to a percentage of the Average True Range (ATR). Only significant candles (those with larger bodies) are plotted, reducing weak or indecisive signals.
Trend Filtering with Moving Average:
The indicator uses a simple moving average (SMA) as a trend filter. By comparing the Heiken Ashi Close to the moving average:
Bullish Trend: The Heiken Ashi candle is green when it’s above the moving average.
Bearish Trend: The Heiken Ashi candle is red when it’s below the moving average.
How to Use This Indicator:
Trend Identification:
Green candles signify a bullish trend, while red candles signify a bearish trend.
The smoothing and trend filtering make it easier to identify sustained trends and avoid reacting to short-term fluctuations.
Filtering Out Noise:
Minor price fluctuations and small-bodied candles (often resulting in indecisive signals) are filtered out, leaving only significant signals.
Adjustable Parameters:
Smoothing Length: Controls the degree of smoothing applied to the Heiken Ashi Close value. Increasing this value will make the Heiken Ashi candles smoother.
Minimum Body Size: This is a percentage of the ATR, used to filter out small or indecisive candles.
Trend Moving Average Length: Controls the period of the moving average used as a trend filter.
This Smoothed Heiken Ashi Trend Filter indicator is useful for identifying trends and filtering out noisy signals. By smoothing and filtering, it helps traders focus on the overall trend rather than minor price movements.
Let me know if there’s anything more you’d like to add or adjust!
OBV based on Heikin-AshiDescription
This indicator calculates the On-Balance Volume (OBV) based on Heikin-Ashi candles rather than regular candlesticks.
OBV based on Heikin-Ashi: The OBV is calculated based on Heikin-Ashi candle trends. Volume is added when the Heikin-Ashi close is above the open (bullish) and subtracted when the close is below the open (bearish).
Volume Analysis: This approach helps traders identify significant volume shifts in a smoother trend environment, reducing market noise that often accompanies traditional candlestick charts.
説明
このインジケーターは、通常のローソク足ではなく、平均足(Heikin-Ashi)を基にオンバランス・ボリューム(OBV)を計算します。
平均足に基づくOBV: OBVは、平均足のトレンドに基づいて計算されます。平均足の終値が始値を上回った場合(陽線)は出来高が加算され、終値が始値を下回った場合(陰線)は出来高が減算されます。
出来高分析: この手法により、通常のローソク足チャートで発生するノイズを軽減し、滑らかなトレンド環境で重要な出来高の変化を把握できます。

Heikin Ashi & Swing Highs/LowsHeikin Ashi & Swing Highs/Lows
Indicator Description:
The "Heikin Ashi & Swing Highs/Lows" indicator combines Heikin Ashi candle analysis with the identification of significant swing highs and lows on the chart. This indicator is useful for traders looking to spot trend changes and key points in the market.
Key Features:
Heikin Ashi:
Calculation and Visualization: Utilizes the Heikin Ashi method to smooth out the candlestick chart, helping to visualize trends and reduce market noise. Heikin Ashi candles are calculated from the standard candles (Open, High, Low, Close) and are displayed on the chart with a green color for bullish signals and red for bearish signals.
Vertical Offset Adjustment: Provides options to adjust the vertical offset of the candles based on the selected timeframe, with specific adjustments for short, medium, long, and super-long periods.
Swing Highs/Lows:
Key Point Identification: Marks significant swing highs and lows on the chart using a configurable period. Swing highs are displayed in red and swing lows in green.
Candlestick Patterns: Detects and labels common candlestick patterns such as:
Hammer: A bullish candlestick pattern with a small body and a long lower wick.
Inverted Hammer: Similar to the Hammer, but with a long upper wick.
Bullish Engulfing: A two-candle pattern where a bullish candle completely engulfs a previous bearish candle.
Hanging Man: A bearish pattern with a small body and a long lower wick, appearing at the end of an uptrend.
Shooting Star: A bearish pattern with a small body and a long upper wick, appearing at the end of an uptrend.
Bearish Engulfing: A two-candle pattern where a bearish candle completely engulfs a previous bullish candle.
Settings:
Timeframe: Allows you to select the desired timeframe to adjust the Heikin Ashi candle analysis.
Vertical Offset: Customize the vertical offset of Heikin Ashi candles based on the selected timeframe.
Swing Point Style: Configure the colors of the significant swing highs and lows on the chart.
Recommended Use:
This indicator is ideal for traders looking for a clear representation of trends through Heikin Ashi candles and who want to identify key reversal points in the market by detecting swing highs/lows and candlestick patterns.
Benefits:
Facilitates the identification of smooth trends and trend reversals.
Provides a clear visual representation of critical market points.
Helps traders recognize important candlestick patterns that may indicate changes in market direction.

Optimized Heikin Ashi Strategy with Buy/Sell OptionsStrategy Name:
Optimized Heikin Ashi Strategy with Buy/Sell Options
Description:
The Optimized Heikin Ashi Strategy is a trend-following strategy designed to capitalize on market trends by utilizing the smoothness of Heikin Ashi candles. This strategy provides flexible options for trading, allowing users to choose between Buy Only (long-only), Sell Only (short-only), or using both in alternating conditions based on the Heikin Ashi candle signals. The strategy works on any market, but it performs especially well in markets where trends are prevalent, such as cryptocurrency or Forex.
This script offers customizable parameters for the backtest period, Heikin Ashi timeframe, stop loss, and take profit levels, allowing traders to optimize the strategy for their preferred markets or assets.
Key Features:
Trade Type Options:
Buy Only: Enter a long position when a green Heikin Ashi candle appears and exit when a red candle appears.
Sell Only: Enter a short position when a red Heikin Ashi candle appears and exit when a green candle appears.
Stop Loss and Take Profit:
Customizable stop loss and take profit percentages allow for flexible risk management.
The default stop loss is set to 2%, and the default take profit is set to 4%, maintaining a favorable risk/reward ratio.
Heikin Ashi Timeframe:
Traders can select the desired timeframe for Heikin Ashi candle calculation (e.g., 4-hour Heikin Ashi candles for a 1-hour chart).
The strategy smooths out price action and reduces noise, providing clearer signals for entry and exit.
Inputs:
Backtest Start Date / End Date: Specify the period for testing the strategy’s performance.
Heikin Ashi Timeframe: Select the timeframe for Heikin Ashi candle generation. A higher timeframe helps smooth the trend, which is beneficial for trading lower timeframes.
Stop Loss (in %) and Take Profit (in %): Enable or disable stop loss and take profit, and adjust the levels based on market conditions.
Trade Type: Choose between Buy Only or Sell Only based on your market outlook and strategy preference.
Strategy Performance:
In testing with BTC/USD, this strategy performed well in a 4-hour Heikin Ashi timeframe applied on a 1-hour chart over a period from January 1, 2024, to September 12, 2024. The results were as follows:
Initial Capital: 1 USD
Order Size: 100% of equity
Net Profit: +30.74 USD (3,073.52% return)
Percent Profitable: 78.28% of trades were winners.
Profit Factor: 15.825, indicating that the strategy's profitable trades far outweighed its losses.
Max Drawdown: 4.21%, showing low risk exposure relative to the large profit potential.
This strategy is ideal for both beginner and advanced traders who are looking to follow trends and avoid market noise by using Heikin Ashi candles. It is also well-suited for traders who prefer automated risk management through the use of stop loss and take profit levels.
Recommended Use:
Best Markets: This strategy works well on trending markets like cryptocurrency, Forex, or indices.
Timeframes: Works best when applied to lower timeframes (e.g., 1-hour chart) with a higher Heikin Ashi timeframe (e.g., 4-hour candles) to smooth out price action.
Leverage: The strategy performs well with leverage, but users should consider using 2x to 3x leverage to avoid excessive risk and potential liquidation. The strategy's low drawdown allows for moderate leverage use while maintaining risk control.
Customization: Traders can adjust the stop loss and take profit percentages based on their risk appetite and market conditions. A default setting of a 2% stop loss and 4% take profit provides a balanced risk/reward ratio.
Notes:
Risk Management: Traders should enable stop loss and take profit settings to maintain effective risk management and prevent large drawdowns during volatile market conditions.
Optimization: This strategy can be further optimized by adjusting the Heikin Ashi timeframe and risk parameters based on specific market conditions and assets.
Backtesting: The built-in backtesting functionality allows traders to test the strategy across different market conditions and historical data to ensure robustness before applying it to live trading.
How to Apply:
Select your preferred market and chart.
Choose the appropriate Heikin Ashi timeframe based on the chart's timeframe. (e.g., use 4-hour Heikin Ashi candles for 1-hour chart trends).
Adjust stop loss and take profit based on your risk management preference.
Run backtesting to evaluate its performance before applying it in live trading.
This strategy can be further modified and optimized based on personal trading style and market conditions. It’s important to monitor performance regularly and adjust settings as needed to align with market behavior.

Heikin Ashi Price DetectionThis script performs custom calculations for both bullish and bearish bars, providing a numerical result that can be used to gauge price movements and potential trading signals.
How It Works
Bullish Bars:
Calculates the absolute difference between the open and low prices (BullOpenLow).
Calculates the absolute difference between the high and close prices (BullHighClose).
Compares BullOpenLow and BullHighClose:
If BullOpenLow is greater, the difference is divided by BullOpenLow.
If BullHighClose is greater, the difference is divided by BullHighClose.
The result is normalized to a percentage and subtracted from 100 to produce a final value.
Bearish Bars:
Calculates the absolute difference between the close and low prices (BearCloseLow).
Calculates the absolute difference between the high and open prices (BearHighOpen).
Compares BearCloseLow and BearHighOpen:
If BearCloseLow is greater, the difference is divided by BearCloseLow.
If BearHighOpen is greater, the difference is divided by BearHighOpen.
The result is normalized to a percentage and subtracted from 100 to produce a final value.
Key Features
Bullish and Bearish Calculations: The script identifies bullish and bearish bars and applies separate calculations to each.
Normalized Results: The calculations provide a normalized result that can be easily interpreted.
Visual Representation: Results are plotted on the chart for quick visual reference.

Pivot Points with MID LevelsThis indicator shows the Standard Pivot Points level based on daily values that can act as support and resistance. It is used by a variety of traders around the world. You can select which time frame Pivot Point Levels you'd like. Daily, weekly etc... Perfect for swing trading or day trading.
Pivot Points- Shows 3 levels of resistance, the Pivot Point and 3 levels of support
(R3, R2, R1, PIVOT POINT, S1, S2, S3
MID Levels- The MID levels are 50% retracement from the pivot point level above it and below
Example- R3, MID, R2, MID, R1, MID, PIVOT POINT, MID, S1, MID, S2, MID, S3
With this indicator you will also have the option to show the Previous days High and Low that are also important levels. On gap up/down days it is always interesting to see if price will close the gap, hence the important level to note.
PDH= Previous Days High
PDL= Previous Days Low
I have added a feature that you can now select specific color to each level and the line style for each level to help understand which levels are being show by personal needs.
Happy Trading

Dead Simple Heikin Ashi Candles (HA Candles)Are you looking for a dead simple calculation of the Heikin Ashi candles as they are calculated in tradingview? Here it is!
I was looking through the library and I saw that many have come up with a lot of awesome scripts using heikin ashi candles. But, I can't find anywhere that had the straightforward simple version of how Tradingview calculates them. This was a problem for me because I realized after punching the formula in that TradingView doesn't calculate HA candles in the original way.
You might say they don't calculate them the "right" but, spoiler alert, there is no right in trading. You can only be rational or irrational as you make money or lose money.
This is useful to me for building out some portions of an algo that are not going to be compatible with the built-in function. It happens. So, if you were looking for it too, hopefully it saves you some time.
For reference the original calc of HA candles is:
o = (prev_HA_open + prev_HA_close) / 2
h = math.max(high, ha_open, ha_close)
l = math.min(low, ha_open, ha_close)
c = ohlc4
Trade Well.