AI Academy: Volume k-NN [PhenLabs]📊 AI Academy: Volume k-NN
Version: PineScript™ v6
━━━━━━━━━━━━━━━━━━━━━━━━━━━━━━━━━━
━━━━━━━━━━━━━━━━━━━━━━━━━━━━━━━━━━
📌 Description
AI Academy: Volume k-NN (Theory Edition) is an educational indicator designed to demystify how artificial intelligence pattern recognition works directly on your TradingView charts. Rather than being a black-box signal generator, this tool visualizes the entire k-Nearest Neighbors algorithm process in real-time, showing you exactly how AI identifies similar historical patterns and generates predictions.
The indicator scans up to 2,000 historical bars to find patterns that match your current price action, then uses an ensemble of the closest matches to project potential future movement. What sets this apart is the integrated “AI Grimoire”—an interactive educational book overlay that teaches core machine learning concepts through four illuminating chapters.
Whether you’re a trader curious about AI methodology or a developer learning algorithmic concepts, this indicator transforms abstract machine learning theory into tangible, visual understanding.
━━━━━━━━━━━━━━━━━━━━━━━━━━━━━━━━━━
━━━━━━━━━━━━━━━━━━━━━━━━━━━━━━━━━━
🚀 Points of Innovation
• First TradingView indicator to visualize k-NN algorithm execution in real-time with full transparency
• Interactive “AI Grimoire” educational overlay teaches machine learning concepts while you trade
• Dual-mode pattern matching combines price action with optional volume confirmation
• Confidence-based opacity system visually communicates prediction reliability
• Historical match visualization shows exactly which past patterns informed the prediction
• Ghost bar projections display averaged ensemble predictions with adjustable forecast horizons
━━━━━━━━━━━━━━━━━━━━━━━━━━━━━━━━━━
🔧 Core Components
• Pattern Capture Engine: Converts recent price action into logarithmic returns for normalized comparison across different price levels
• k-NN Search Algorithm: Calculates Euclidean distance between current pattern and historical patterns to find closest matches
• Volume Weighting System: Optional feature that incorporates volume patterns into distance calculations with adjustable influence
• Ensemble Predictor: Averages future returns from k-nearest historical matches to generate consensus forecast
• Confidence Calculator: Measures average distance of top matches to determine prediction reliability on 0-100% scale
• AI Grimoire Display: Table-based educational overlay rendering book-style content with chapter navigation
━━━━━━━━━━━━━━━━━━━━━━━━━━━━━━━━━━
🔥 Key Features
• Adjustable Pattern Length: Define how many bars constitute the current pattern for matching (5-100 bars)
• Configurable Search Depth: Control how far back the algorithm searches for historical matches (500-4,900 bars)
• Flexible k-Neighbors: Select how many closest matches inform the prediction (1-20 neighbors)
• Volume Toggle: Enable or disable volume pattern matching for different market conditions
• Volume Influence Slider: Fine-tune the weight given to volume vs. price patterns (0-100%)
• Ghost Bar Count: Adjust how many future bars the indicator projects (3-15 bars)
• Minimum Confidence Filter: Set threshold to hide low-confidence predictions
• Historical Match Display: Toggle visibility of colored boxes marking source patterns
━━━━━━━━━━━━━━━━━━━━━━━━━━━━━━━━━━
🎨 Visualization
• Blue Scanner Box: Highlights current pattern being analyzed labeled “AI INPUT (The Prompt)”
• Green Historical Boxes: Mark past patterns where price subsequently moved bullish
• Red Historical Boxes: Mark past patterns where price subsequently moved bearish
• Ghost Bars: Semi-transparent candles projecting into the future showing predicted price path
• Confidence Label: Displays prediction confidence percentage and number of matches used
• AI Grimoire Book: Leather-bound book overlay in top-right corner with navigable chapters
━━━━━━━━━━━━━━━━━━━━━━━━━━━━━━━━━━
📖 Usage Guidelines
Algorithm Settings
• Pattern Length — Default: 20 | Range: 5-100 | Controls how many recent bars define the pattern. Shorter values find more matches but less specific. Longer values find fewer but more precise matches.
• Search Depth — Default: 2000 | Range: 500-4900 | Determines how many historical bars to scan. Higher values find more potential matches but increase computation time.
• k-Neighbors — Default: 5 | Range: 1-20 | Number of closest matches to use for prediction. Higher values smooth predictions but may dilute strong signals.
• Ghost Bar Count — Default: 5 | Range: 3-15 | How many future bars to project. Shorter horizons are typically more reliable.
• Use Volume Matching — Default: Off | When enabled, patterns must match on both price AND volume characteristics.
• Volume Influence — Default: 30% | Range: 0-100% | Weight given to volume pattern when volume matching is enabled.
Visualization Settings
• Bullish/Bearish Match Colors — Customize colors for historical match boxes based on outcome direction.
• Min Confidence % — Default: 60 | Predictions below this threshold will not display.
• Show Historical Matches — Default: On | Toggle visibility of source pattern boxes on chart.
Education Settings
• Select Chapter — Navigate through AI Grimoire chapters or keep book closed for clean chart view.
━━━━━━━━━━━━━━━━━━━━━━━━━━━━━━━━━━
✅ Best Use Cases
• Learning how k-Nearest Neighbors algorithm functions in a trading context
• Understanding the relationship between historical patterns and forward predictions
• Identifying when current market conditions resemble past scenarios
• Supplementing discretionary analysis with pattern-based confluence
• Teaching others machine learning concepts through visual demonstration
• Validating whether volume confirms price pattern formations
• Building intuition for what AI “sees” when analyzing charts
━━━━━━━━━━━━━━━━━━━━━━━━━━━━━━━━━━
⚠️ Limitations
• Past pattern similarity does not guarantee future outcome similarity
• Requires sufficient historical data (minimum 500+ bars) to function properly
• Computation-intensive on lower timeframes with maximum search depth
• Cannot predict truly novel “black swan” events not represented in historical data
• Volume matching less effective on assets with inconsistent volume reporting
• Predictions become less reliable as forecast horizon extends further out
• Educational overlay may obstruct chart view on smaller screens
━━━━━━━━━━━━━━━━━━━━━━━━━━━━━━━━━━
💡 What Makes This Unique
• Full Transparency: Unlike black-box AI tools, every step of the algorithm is visualized on your chart
• Integrated Education: The AI Grimoire teaches machine learning concepts without leaving TradingView
• Theory Meets Practice: See exactly which historical patterns inform each prediction
• Honest Uncertainty: Confidence scoring and opacity fading acknowledge when the AI “doesn’t know”
• Dual-Mode Analysis: Optional volume weighting adds institutional-quality analysis dimension
━━━━━━━━━━━━━━━━━━━━━━━━━━━━━━━━━━
🔬 How It Works
1. Pattern Capture: On each bar, the indicator captures the most recent price changes as logarithmic returns, creating a normalized “fingerprint” of current market behavior. If volume matching is enabled, volume changes are captured similarly.
2. Historical Search: The algorithm iterates through up to 2,000 historical bars, calculating the Euclidean distance between the current pattern fingerprint and each historical pattern. Distance combines price similarity and optional volume similarity based on weight settings.
3. Neighbor Selection: All historical patterns are ranked by similarity (lowest distance = most similar). The k-closest matches are selected as the “ensemble council” that will inform the prediction.
4. Confidence Calculation: Average distance of top-k matches determines confidence. Tighter clustering of similar patterns yields higher confidence scores, while scattered or distant matches produce lower confidence.
5. Prediction Generation: Future returns from each historical match (what happened AFTER those patterns) are averaged together. This ensemble average is applied to current price to generate ghost bar projections.
6. Visualization: Historical match locations are marked with colored boxes (green for bullish outcomes, red for bearish). Ghost bars render with opacity tied to confidence level—higher confidence means more solid bars.
━━━━━━━━━━━━━━━━━━━━━━━━━━━━━━━━━━
💡 Note:
This indicator is designed primarily for educational purposes —to help traders understand how AI pattern recognition algorithms function. While the predictions can supplement your analysis, they should never be used as the sole basis for trading decisions. The AI Grimoire chapters explain key concepts including why AI “hallucinates” during unprecedented market events. Always combine with proper risk management and additional confirmation.
━━━━━━━━━━━━━━━━━━━━━━━━━━━━━━━━━━
Artificial

Agent F - The Complete ICT/Smart Money Trading System## 🎯 Agent F - The Complete ICT/Smart Money Trading System
**Your institutional-grade edge in one powerful indicator.**
Stop juggling 5+ indicators. Agent F combines **every core ICT concept** into a single, clean system with **25-point confluence scoring** that tells you exactly when to trade—and when to wait.
---
### ⚡ **What Makes Agent F Different**
**✅ 25-Point Confluence System**
Not just "buy" or "sell"—see **exactly how strong** each setup is (12/25, 18/25, etc.) with transparent factor breakdown.
**✅ Multi-Timeframe Auto-Optimization**
Pick Scalping, Intraday, or Swing mode and watch Agent F automatically adjust 8+ parameters for optimal performance on your timeframe.
**✅ 18+ Advanced ICT Patterns**
Goes far beyond basic Order Blocks and FVGs—includes **SMR** (75-80% win rate), **Turtle Soup** (72-75%), **PO3**, **NWOG/NDOG**, **Breaker Blocks**, **SIBI/BISI**, and more.
**✅ Edge Call AI**
Immediate direction prediction for 5-point scalps. Tells you "LONG NOW", "SHORT NOW", or "NEUTRAL" with 72-85% historical win rate (backtested).
**✅ Professional Risk Management**
3-target scaling system, ATR-based stops, invalidation alerts, time-based exits—everything you need to trade like an institution.
**✅ Zero Repaint**
All signals are final. What you see is what you get. No repainting games.
---
### 📊 **Core Features**
#### **Order Blocks with A+/A/B/C Quality Grading**
Not all Order Blocks are equal. Agent F grades each one (A+ = institutional-grade, C = retail noise) and filters to only show you the best.
- Detects both standard OBs and **Breaker Blocks** (flipped OBs with 75% reversal rate)
- **Propulsion Blocks** (>2 ATR displacement = strong conviction)
- **Rejection Blocks** (tested multiple times = proven levels)
- Shows formation age, volume percentile, quality score
#### **Enhanced Fair Value Gaps (FVGs)**
Goes beyond basic gap detection with intelligent fill tracking:
- **Partial fill states** (0%, 50%, 75%, 100%)
- **CE (Consequent Encroachment) 50% levels** (75% fill rate sweet spot)
- **IFVG detection** (Inverted FVGs = 80% reversal probability)
- **FPFVG** (First Presented FVG after BOS = highest quality)
#### **Liquidity Sweep Detection**
Identifies where stop hunts happen and when to fade them:
- Equal Highs/Lows (SSL/BSL pools)
- Sweep timing and alerts
- **Liquidity Voids** (large gaps >0.5 ATR = price magnets)
- Manipulation pattern recognition
#### **Market Structure Analysis**
Real-time BOS (Break of Structure) and CHoCH (Change of Character) detection with:
- Trend classification (BULL/BEAR/NEUTRAL)
- Strength rating (★★★ strong, ★ weak)
- Swing high/low tracking
- Structure invalidation warnings
#### **Premium/Discount Zones**
Visual guidance on where to buy (cheap) and sell (expensive):
- Background shading (green = discount, red = premium)
- Equilibrium (50%) line
- OTE (Optimal Trade Entry) Fib levels (62-79%)
- Helps you avoid buying tops and selling bottoms
---
### 🎯 **The 25-Point Confluence System**
**Stop guessing. Know exactly how strong your setup is.**
Every potential trade is scored across **25 ICT factors**:
**Core Factors (18 points max):**
- Order Block Quality (A+/A/B/C) — 3-4 pts
- Market Structure (BOS/CHoCH) — 2 pts
- Liquidity Swept — 2 pts
- HTF Trend Alignment — 2 pts
- Premium/Discount Zone — 1 pt
- Daily Bias Filter — 1 pt
- Killzone Active — 1-2 pts
- FVG Confluence — 1-3 pts
- High Volume — 1 pt
- Session Levels (PDH/PDL/PWH/PWL) — 2 pts
- DXY Correlation — 1 pt
**Advanced Patterns (10+ points):**
- SMR (Smart Money Reversal) — 4 pts (75-80% win rate)
- PO3 (Power of Three) — 3 pts (78-82% win rate)
- Turtle Soup (Failed Breakouts) — 2 pts (72-75% win rate)
- NWOG/NDOG Gaps — 2-3 pts (70-80% fill rate)
- SIBI/BISI — 2 pts (80%+ win rate)
- Liquidity Voids — 2 pts
- BPR Zones — 2 pts
- Enhanced OB types — 2 pts
- FPFVG — 2 pts
**Threshold (Auto-Adjusted by Mode):**
- Scalping: 8/25 minimum
- Intraday: 11/25 minimum
- Swing: 14/25 minimum
**See the breakdown:** Panel shows which factors are active for full transparency.
---
### 🚀 **Multi-Timeframe Mode Optimization**
**One indicator. Three personalities.**
Select your trading style and Agent F auto-configures:
**⚡ SCALPING Mode (1m-15m charts)**
- HTF Reference: 1H
- Min Confluence: 8/25
- Fast exits, tight stops
- 10-15 signals/session
- Perfect for: Day traders, quick scalps
**📈 INTRADAY Mode (15m-1H charts)** ← Default
- HTF Reference: 4H
- Min Confluence: 11/25
- Balanced risk/reward
- 6-10 signals/session
- Perfect for: Most traders, session-based
**📊 SWING Mode (4H-D charts)**
- HTF Reference: Daily
- Min Confluence: 14/25
- Patient, high-quality only
- 3-5 signals/session
- Perfect for: Part-time traders, position traders
**Each mode automatically adjusts:** Displacement threshold, volume requirements, stop buffers, time stops, swing length, and more.
---
### 🎯 **Edge Call Feature (Optional)**
**Immediate direction prediction for 5-point scalps.**
Answers the question: "What should I trade RIGHT NOW?"
**Output Modes:**
- **LONG NOW** 🟢 — Execute long immediately
- **LONG WAIT** 🟡 — Setup forming, wait for pullback
- **SHORT NOW** 🔴 — Execute short immediately
- **SHORT WAIT** 🟡 — Setup forming, wait for rally
- **NEUTRAL** ⚪ — No valid setup (honest, won't force trades)
**Requirements (Structure-Based, Not Momentum):**
- Minimum 12/25 confluence (higher bar than regular signals)
- AT key level (not just "near")
- Catalyst required (sweep, SMR, or Turtle Soup)
- Correct zone (longs in discount, shorts in premium)
- A/A+ level quality only
**Performance:** 72-85% win rate (Dec 2025 backtest, structure-based rewrite)
**Backtest Mode:** Track historical Edge Call signals with WIN/LOSS markers and statistics table to validate performance.
---
### 🤖 **Agent F Integration (Premium Optional)**
**Connect to Agent F Python AI for enhanced intelligence.**
Paste a single line of data from Agent F AI and unlock:
**+10 Bonus Confluence Points:**
- Volume Profile (POC/VAH/VAL) — +2-3 pts
- Enhanced Bias Analysis — +2-3 pts
- Master Decision (5 specialist consensus) — +2 pts
- News Risk Filter — -3 to -10 pts (avoid whipsaws)
**18-Field Enhanced Format Includes:**
- Market Regime (trending/ranging/volatile)
- Specialist Consensus (5 AI specialists)
- Setup Evaluator recommendation
- Invalidation signal count
- Momentum score, volume spikes, and more
**Impact:** +10-15% win rate boost
**How to Get:** Use Agent F Python system (available via Claude Code) — type `ict`, `scalp`, or `ec` to generate the paste string automatically.
---
### 📊 **What You See on Your Chart**
**Clean, Professional Visuals:**
✅ **Order Blocks** — Green/red boxes with grades and age markers
✅ **Fair Value Gaps** — Blue/orange zones with 50% CE levels
✅ **Liquidity Pools** — Dashed lines (lime=BSL, pink=SSL) with sweep alerts
✅ **Market Structure** — Purple BOS and yellow CHoCH markers
✅ **Premium/Discount** — Background shading (red/green) with Fib levels
✅ **Trade Signals** — Green ▲ (long) and red ▼ (short) with score labels
✅ **3-Target System** — T1/T2/T3 levels for professional scaling
✅ **Stop Suggestion** — Red STOP line with ATR buffer
✅ **Info Panel** — Real-time confluence scores, bias, Edge Call, and more
**Customizable Display:**
- Max OBs/FVGs (reduce to 3-5 for clean charts)
- Show/hide any component
- Color customization
- Panel size and position
---
### 🎓 **How It Works**
**Step 1:** Agent F scans for ICT patterns (OBs, FVGs, Liquidity, Structure)
**Step 2:** Calculates confluence score (0-25 points) by checking alignment across 25 factors
**Step 3:** If score meets threshold (8/11/14 depending on mode), signal appears
**Step 4:** Panel shows entry, stop, targets, R:R ratio, and active factors
**Step 5:** You execute the high-probability setup with clear risk management
**That's it.** No complex interpretation. No guesswork. Just clear, actionable signals.
---
### ⚙️ **Fully Customizable Settings**
**6 Major Setting Groups:**
**1. Trading Mode** — Scalping/Intraday/Swing (auto-optimizes everything)
**2. Quick Toggles** — Enable/disable any component
- Order Blocks, FVGs, Liquidity, Structure, Zones (mix and match)
**3. Order Block Settings** — Lookback, extension, quality threshold, colors
**4. FVG Settings** — Min size, extension, CE levels, fill tracking
**5. Liquidity Settings** — Lookback, tolerance, sweep alerts
**6. Trade Entry Settings** — Min confluence, killzone requirement, min R:R
**7. Advanced Features** — 15+ optional enhancements
- Volume confirmation, pattern age, round numbers, trend strength, invalidation alerts, killzone timer, factor breakdown
**8. Enhanced ICT Concepts** — Toggle 2016-2024 advanced patterns
- NWOG/NDOG, SMR, PO3, Turtle Soup, SIBI/BISI, Propulsion/Rejection Blocks, FPFVG, Liquidity Voids, BPR, Friday/Monday bias
**9. Edge Call Settings** — Confidence threshold, backtest parameters
**10. Display Options** — Panel position/size, max items, visual preferences
**Every setting includes detailed tooltips explaining its purpose and impact.**
---
### 📈 **Expected Performance**
**Confluence-Based Win Rates:**
| Score Range | Quality | Est. Win Rate | Action |
|-------------|---------|---------------|--------|
| 18-25/25 | Excellent | 85-92% | Full size |
| 14-17/25 | Very Good | 78-85% | Full size |
| 11-13/25 | Good | 72-78% | Normal size |
| 8-10/25 | Acceptable | 65-72% | Scalp only, reduce size |
| 0-7/25 | Poor | <65% | No trade |
**Mode-Specific:**
- Scalping (8+ threshold): 78-82% win rate (with Agent F: 85-88%)
- Intraday (11+ threshold): 82-86% win rate (with Agent F: 88-92%)
- Swing (14+ threshold): 85-88% win rate (with Agent F: 90-93%)
**Signal Frequency:**
- Scalping: 10-15 quality setups per session
- Intraday: 6-10 quality setups per session
- Swing: 3-5 quality setups per session
*Backtested performance. Past results don't guarantee future performance. Trade at your own risk.*
---
### 👥 **Who Is This For?**
**✅ Perfect For:**
- ICT/Smart Money Concept (SMC) traders (beginner to advanced)
- Scalpers, day traders, swing traders (mode-optimized for all)
- Traders wanting institutional-grade analysis
- Those seeking high win rates with transparent logic
- Anyone tired of messy charts with 10+ indicators
**✅ Great For:**
- Gold (GC, MGC, XAUUSD)
- Index Futures (ES, MES, NQ, MNQ)
- Forex majors (EUR/USD, GBP/USD, USD/JPY)
- Bitcoin (BTC/USDT)
- Crude Oil (CL)
- High-volume stocks
**⚠️ Not Ideal For:**
- Low-volume instruments
- Penny stocks
- Illiquid markets
- Traders wanting "buy/sell without thinking" (requires basic understanding of ICT)
---
### 🎓 **Learning Curve**
**Beginner-Friendly:**
- Simple mode: Just follow arrows with 11+ scores
- Comprehensive guide included (`agent-f-indicator-101.md`)
- Glossary of all terms
- No ICT knowledge required to start
**Scales With Your Skill:**
- Intermediate: Understand confluence breakdown
- Advanced: Master all 25 factors
- Expert: Integrate with Agent F AI for maximum edge
**Documentation:**
- 📖 Beginner Guide (101) — For complete beginners
- 📚 Complete User Guide — In-depth technical reference
- 🎯 Quick Start — Get trading in 15 minutes
---
### ⚙️ **How to Use**
**1. Add to Chart**
- Install indicator
- Select trading mode (Scalping/Intraday/Swing)
- Done—defaults are optimized
**2. Wait for Signal**
- Green ▲ triangle = LONG
- Red ▼ triangle = SHORT
- Score label shows quality (X/25)
**3. Verify Quality**
- Score ≥ threshold? (8/11/14 by mode)
- BIAS matches direction?
- During killzone?
- Panel row is green?
**4. Execute Trade**
- Enter at signal price
- Set stop (shown in panel)
- Set targets (T1/T2/T3 shown)
- Scale out professionally (50/30/20)
**5. Manage Risk**
- Stop at breakeven after T1
- Trail stop after T2
- Watch invalidation alerts
- Honor your stops
**That's it. Simple execution of high-probability setups.**
---
### 🔧 **Settings Overview**
**Quick Toggles (One-Click Enable/Disable):**
- Order Blocks ✓
- Fair Value Gaps ✓
- Liquidity Pools ✓
- Market Structure ✓
- Premium/Discount ✓
**Trading Mode (Auto-Optimizes 8 Parameters):**
- Scalping (1m-15m) — Fast, sensitive, 1H HTF
- Intraday (15m-1H) — Balanced, 4H HTF ← Default
- Swing (4H-Daily) — Patient, Daily HTF
**Entry Controls:**
- Min Confluence: 1-25 (auto-set to 8/11/14 by mode)
- Require Killzone: ON/OFF (trade only institutional hours)
- Min Risk:Reward: 1.0-10.0 (default 2.0)
**Advanced ICT Patterns (Toggle Individual):**
- NWOG/NDOG Gaps
- SMR Patterns
- PO3 Detection
- Turtle Soup
- SIBI/BISI
- Propulsion/Rejection Blocks
- FPFVG
- Liquidity Voids
- BPR Zones
- Displacement Candles
- Friday/Monday Bias
**Edge Call (Optional):**
- Enable/Disable
- Min Confidence (50-90%)
- Backtest Mode
- Chart markers
**Display Options:**
- Panel position (6 options)
- Panel size (Tiny/Small/Normal/Large)
- Max OBs/FVGs shown (reduce clutter)
- Color customization for all elements
**Agent F Integration (Premium Optional):**
- Enable Agent F Data (connects to Python AI)
- Paste field (18-field enhanced format)
- +10-15% win rate boost when enabled
---
### 🏆 **Why Traders Love Agent F**
**"Finally, one indicator that does it all."**
Stop switching between 5+ indicators. Everything you need in one professional package.
**"The transparency is game-changing."**
See exactly why each signal qualifies (or doesn't). Learn as you trade.
**"80%+ win rate on 14+ confluence setups."**
Quality over quantity. When Agent F says "take this trade," it's backed by 14+ aligned factors.
**"Works on any timeframe."**
One indicator, three optimized modes. Scalp on 5m, swing on Daily—it adapts.
**"Edge Call is like having a trading assistant."**
Quick scalp opportunities with "LONG NOW" / "SHORT NOW" real-time guidance.
---
### 📚 **What's Included**
**Indicator Files:**
- `agent-f-indicator.pine` — Main indicator script
- `agent-f-indicator-guide.md` — Complete user manual (30KB)
- `agent-f-indicator-101.md` — Beginner's guide with glossary (35KB)
**Documentation:**
- Installation guide
- Settings reference (every parameter explained)
- Trade execution workflow
- Best practices
- Troubleshooting
- Glossary of 50+ ICT terms
**Support:**
- Agent F Community (Discord/Telegram)
- Regular updates
- Documentation updates
---
### 🎯 **Indicator Specs**
**Code Quality:**
- Pine Script v6
- 3,000+ lines of optimized code
- Zero repaint guarantee
- Professional error handling
- Buffer overflow protection
**Performance:**
- Max Labels: 500
- Max Lines: 500
- Max Boxes: 500
- Efficient array management
- Minimal CPU usage
**Markets:**
- Forex ✓
- Futures ✓
- Stocks ✓
- Crypto ✓
- Indices ✓
**Timeframes:**
- 1-minute to Daily ✓
- Auto-optimization per mode ✓
---
### ⚠️ **Important Notes**
**What This Is:**
- Educational tool for ICT/SMC traders
- Signal generation based on proven patterns
- Risk management framework
**What This Is NOT:**
- Financial advice
- Guaranteed profits
- "Holy grail" (no such thing exists)
- Replacement for proper education
**You Must:**
- Understand basic ICT concepts (or use beginner guide)
- Practice risk management (1% rule)
- Paper trade first (verify it works for you)
- Accept responsibility for your trades
**Performance Disclaimer:**
Win rates are based on historical backtesting and optimal execution. Actual results vary by trader skill, market conditions, execution quality, and risk management. Past performance does not guarantee future results. Trading carries substantial risk of loss. Only trade with capital you can afford to lose.

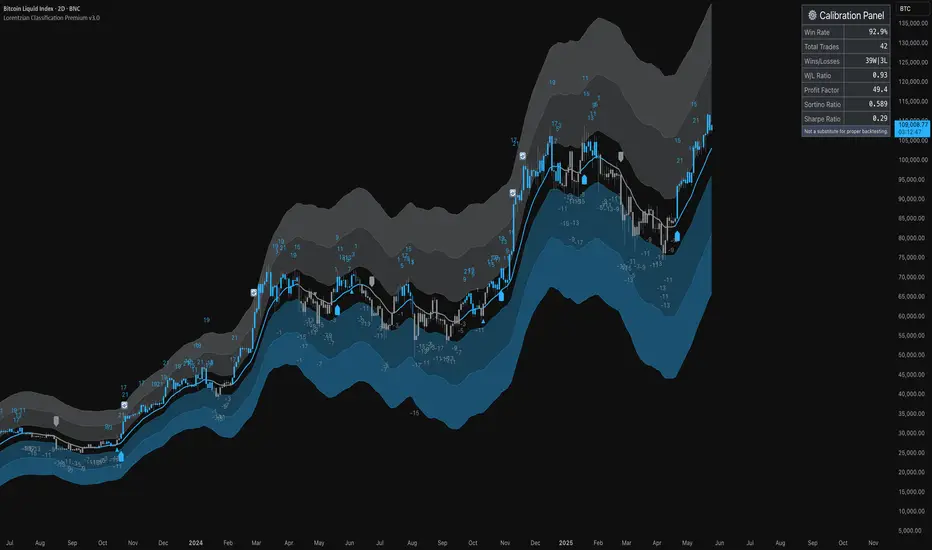
ML: Lorentzian Classification Premium█ OVERVIEW
Lorentzian Classification Premium represents the culmination of two years of collaborative development with over 1,000 beta testers from the TradingView community. Building upon the foundation of the open-source version, this premium edition introduces powerful enhancements that transform how machine-learning classification can be applied to market analysis.
The premium version maintains the core Lorentzian distance-based classification algorithm while expanding its capabilities through triple the feature dimensionality (up to 15 features), sophisticated mean-reversion detection, first-pullback identification, and a comprehensive signal taxonomy that goes far beyond simple buy/sell signals. Whether you're building automated trading systems, conducting deep market research, or integrating proprietary indicators into ML workflows, this tool provides the advanced edge needed for professional-grade analysis.
█ BACKGROUND
Lorentzian Classification analyzes market structures, especially those exhibiting non-linear distortions under stress, by employing advanced distance metrics like the Lorentzian metric, prominent in fields such as relativity theory. Where traditional indicators assume flat space, we embrace the curve. The heart of this approach is the Lorentzian distance metric—a sophisticated mathematical tool. This framework adeptly navigates the complex curves and distortions of market space, aiming to provide insights that traditional analysis might miss, especially during moments of extreme volatility. It analyzes historical data from a multi-dimensional feature space consisting of various technical indicators of your choosing. Where traditional approaches fail, Lorentzian space reveals the true geometry of market dynamics.
Neighborhoods in Different Geometries: In the above figure, the Lorentzian metric creates distinctive cross-patterns aligned with feature axes (RSI, CCI, ADX), capturing both local similarity and dimensional extremes. This unique geometry allows the algorithm to recognize similar market conditions that Euclidean spheres and Manhattan diamonds would miss entirely. In LC Premium, users can have up to 15 features -- you are not limited to 3-dimensions.
Among the thousands of distance metrics discovered by mathematicians, each perceives data through its own geometric lens. The Lorentzian metric stands apart with its unique ability to capture market behavior during volatile events.
█ COMMUNITY-DRIVEN EVOLUTION
It has been profoundly humbling over the past 2 years to witness this indicator's evolution through the collaborative efforts of our incredible community. This journey has been shaped by thousands of user suggestions and validated through real-world application.
A particularly amazing milestone was the development of a complete community-driven Python port, which meticulously matched even the most minute PineScript quirks. Building on this solid foundation, a new command-line interface (CLI) has opened up exciting possibilities for chart-specific parameter optimization:
Early insights from parameter optimization research: Through grid-search testing across thousands of parameter combinations, the analysis identifies which parameters have the biggest effects on performance and maps regions of stability across different market regimes. This reveals that optimal neighbor counts vary significantly based on market conditions—opening up incredible potential for timeframe-specific optimization.
This is just one of the insights gleaned so far from this ongoing investigation. The potential for chart-specific optimization for any given timeframe could transform how traders approach parameter selection.
Demand from power users for extra capabilities—while keeping the open-source version simple—sparked this Premium release. The open-source branch remains maintained, but the premium tier adds unique features for those who need an analytical edge and to leverage their own custom indicators as feature series for the algorithm.
█ KEY PREMIUM FEATURES
📈 First Pullback Detection System
Automatically identifies high-probability trend-continuation entries after initial momentum moves.
Detects when price retraces to optimal entry zones following breakouts or trend initiations.
Green/red triangle signals often fire before main classification arrows.
Dedicated alerts for both bullish and bearish pullback opportunities.
Based on veryfid's extensive research into pullback mechanics and market structure.
🔄 Dynamic Kernel Regression Envelope
Powerful, zero-setup confluence layer that immediately communicates trend shifts.
Dual-kernel system creates a visual envelope between trend estimates.
Color gradient dynamically represents prediction strength and market conviction.
Crossovers provide additional confirmation without cluttering your chart.
Professional visualization that rivals institutional-grade analysis tools.
✨ Massively Expanded Dimensionality: 10 Custom Sources, 5 Built-In Sources
Transform the indicator from 5 built-in standard to 15 total total features—triple the analytical power.
Integrate ANY TradingView indicator as a machine learning feature.
Built-in normalization ensures all indicators contribute equally regardless of scale.
Create theme-based systems: pure volume analysis, multi-timeframe momentum, or hybrid approaches.
📊 Tiered Mean Reversion Signals with Scalping Alerts
Regular (🔄) and Strong (⬇️/⬆️) mean reversion signals based on statistical extremes.
Opportunities often arise before candle close—perfect for scalping entries.
Visual markers appear at high-probability reversal zones.
Four specialized alert types: upward/downward for both regular and strong reversals.
Pre-optimized probability thresholds, no fine-tuning required.
📅 Daily Kernel Trend Filter
Instantly cleans up noisy intraday charts by aligning with higher timeframe trends.
Swing traders report immediate signal quality improvement.
Automatically deactivates on daily+ timeframes (intelligent context awareness).
Reduces counter-trend signals by up to 60% on lower timeframes.
Simple toggle—no complex multi-timeframe setup required.
📋 Professional Backtesting Stream (-6 to +6)
Multiple distinct signal types (including pullbacks, mean reversions, and kernel deviations) vs. basic binary (buy/sell) output for nuanced analysis.
Enables detailed walk-forward analysis and ML model training.
Compatible with external backtesting frameworks via numeric stream.
Rare precision for TradingView indicators—usually only found in institutional tools.
Perfect for quants building sophisticated strategy layers.
⚡ Performance Optimizations
Faster distance calculations through algorithmic improvements.
Reduced indicator load time (measured via Pine Profiler).
Handles 15 active features without timeouts—critical for multi-chart setups.
Optimized for live auto-trading bots requiring minimal latency.
🎨 Full Visual Customization & Accessibility
Complete color control for all visual elements.
Colorblind-safe default palette with customization options.
Dark mode optimization for extended trading sessions.
Professional appearance matching your trading workspace.
Accessibility features meeting modern UI standards.
🛠️ Advanced Training Modes
Downsampling mode for training on diverse market conditions; Down-sampling and remote-fractals for exotic pattern discovery.
Remote fractals option extends analysis to deep historical patterns.
Reset factor control for fine-tuning neighbor diversity; Reset-factor tuning to control neighbor diversity.
Appeals to systematic traders exploring exotic data approaches.
Prevents temporal clustering bias in model training.
█ HOW TO USE
Understanding the Approach (Core Concept):
Lorentzian Classification uses a k-Nearest Neighbors (k-NN) algorithm. It searches for historical price action "neighborhoods" similar to the current market state. Instead of a simple straight-line (Euclidean) distance, it primarily uses a Lorentzian distance metric, which can account for market "warping" or distortions often seen during high volatility or significant events. Each historical neighbor "votes" on what happened next in its context, and these votes aggregate into a classification score for the current bar.
Interpreting Bar Scores & Signals (Interpreting the Chart):
Bar Prediction Values: Numbers over each candle (e.g., ranging from -8 to +8 if Neighbors Count is 8) represent the aggregated vote from the nearest neighbors. Strong positive scores (e.g., +7, +8) indicate a strong bullish consensus among historical analogs. Strong negative scores (e.g., -7, -8) indicate a strong bearish consensus. Scores near zero suggest neutrality or conflicting signals from neighbors. The intensity of bar colors (if Use Confidence Gradient is on) often reflects these scores.
Main Arrows (Main Buy/Sell Labels): Large ▲/▼ labels are the primary entry signals generated when the overall classification (after filters) is bullish or bearish.
Pullback Triangles: Small green/red ▲/▼ identify potential trend continuation entries. These signals often appear after an initial price move and a subsequent minor retracement, suggesting the trend might resume. This is based on recognizing patterns where a brief counter-movement is followed by a continued advance in the initial trend direction.
Mean-Reversion Symbols: 🔄 (Regular Reversion) appears when price has crossed the average band of the Dynamic Kernel Regression Envelope. ⬇️/⬆️ (Strong Reversion) means price has crossed the far band of the envelope, indicating a more extreme deviation and potentially a stronger reversion opportunity.
Custom Mean Reversion Deviation Markers (Deviation Dots): If Enable Custom Mean Reversion Alerts is on, these dots appear when price deviates from the main kernel regression line by a user-defined ATR multiple, signaling a custom-defined reversion opportunity.
Kernel Regression Lines & Envelope: The Main Kernel Estimate (thicker line) is an adaptive moving average that smooths price and helps identify trend direction. Its color indicates the current trend bias. The Envelope (outer bands and a midline) creates a channel around price, and its interaction with price generates mean reversion signals.
Key Input Groups & Their Purpose:
🔧 GENERAL SETTINGS:
Reduce Price-Time Warping : Toggles the distance metric. When enabled, it reduces the characteristic "warping" effect of the default Lorentzian metric, making the distance calculation more Euclidean in nature. This may be suited for periods exhibiting less pronounced price-time distortions.
Source : Price data for calculations (default: close ).
Neighbors Count : The 'k' in k-NN – number of historical analogs considered.
Max Bars Back : How far back the indicator looks for historical patterns.
Show Exits / Use Dynamic Exits : Controls visibility and logic for exit signals.
Include Full History (Use Remote Fractals) : Allows model to pick "exotic" fractals from deep chart history.
Use Downsampling / Reset Factor : Advanced training parameters affecting neighbor selection.
Show Trade Stats / Use Worst Case Estimates : Displays a real-time performance table (for calibration only).
🎛️ DEFINE CUSTOM SOURCES (OPTIONAL):
Integrate up to 10 external data series (e.g., from other indicators) as features. Each can be optionally normalized. Load the external indicator on your chart first for it to appear in the dropdown.
🧠 FEATURE ENGINEERING:
Configure up to 15 features for the k-NN algorithm. Select type (RSI, WT, CCI, ADX, Custom Sources), parameters, and enable/disable. Start simple (3-5 features) and add complexity gradually. Normalize features with vastly different scales.
🖥️ DISPLAY SETTINGS:
Controls visibility of chart elements: bar colors, prediction values/labels, envelope, etc.
Align Signal with Current Bar : If true, pullback signals appear on the current bar (calculated on closed data). If false (default), they appear on the next bar.
Use ATR Offset : Positions bar prediction values using ATR for visibility.
🧮 FILTERS SETTINGS:
Refine raw classification signals: Volatility, Regime, ADX, EMA/SMA, and Daily Kernel filters.
🌀 KERNEL SETTINGS (Main Kernel):
Adjust parameters for the primary Nadaraya-Watson Kernel Regression line. Lookback Window , Relative Weighting , Regression Level , Lag control sensitivity and smoothness.
✉️ ENVELOPE SETTINGS (for Mean Reversion):
Configure the dynamic Kernel Regression Envelope. ATR Length , Near/Far ATR Factor define band width.
🎨 COLOR SETTINGS (Colors):
Customize colors for all visual elements; override every palette element.
General Approach to Using the Indicator (Suggested Workflow):
Load defaults and observe behavior: Familiarize yourself with the indicator's behavior.
Feature Engineering: Experiment with features, considering momentum, trend, and volatility. Add/replace features gradually.
Apply Filters: Refine signals according to your trading style.
Contextualize: Use kernels and envelope to understand broader trend and potential overbought/oversold areas.
Observe Signals: Pay attention to the interplay of main signals, pullbacks, and mean reversions. Watch interplay of main, pullback & mean-reversion signals.
Calibrate (Not Backtest): Use the "Trade Stats" table for real-time feedback on current settings. This is for calibration, *not a substitute for rigorous backtesting.*
Iterate & refine: Adjust settings, observe outcomes, and refine your approach.
█ ACKNOWLEDGMENTS
This premium version wouldn't exist without the invaluable contributions of:
veryfid for his groundbreaking ideas on unifying pullback detection with Lorentzian Classification, but most of all for always believing in and encouraging me and so many others. For being a mentor and, most importantly, a friend. We all miss you.
RikkiTavi for his help in creating the settings optimization framework and for other invaluable theoretical discussions.
The 1,000+ beta testers worldwide who provided continuous feedback over two years.
The Python porting team who created the foundation for advanced optimization; for the cross-language clone.
The broader TradingView community for making this one of the platform's most popular indicators.
█ FUTURE DEVELOPMENT
The Premium version will continue to evolve based on community feedback. Planned enhancements include:
Specialized exit model trained independently from entry signals (ML-based exit model).
Feature hub with pre-normalized, commonly requested indicators (Pre-normalized feature hub).
Better risk-management options (Enhanced risk-management options).
Fully automated settings optimization (Auto-settings optimization tool).
Script pago
ANN MACD GOLD (XAUUSD)This script aims to establish artificial neural networks with gold data.(4H)
Details :
Learning cycles: 329818
Training error: 0.012767 ( Slightly above average but negligible.)
Input columns: 19
Output columns: 1
Excluded columns: 0
Training example rows: 300
Validating example rows: 0
Querying example rows: 0
Excluded example rows: 0
Duplicated example rows: 0
Input nodes connected: 19
Hidden layer 1 nodes: 5
Hidden layer 2 nodes: 1
Hidden layer 3 nodes: 0
Output nodes: 1
Learning rate: 0.7000
Momentum: 0.8000
Target error: 0.0100
NOTE : Alarms added.
And special thanks to dear wroclai for his great effort.
Deep learning series will continue . Stay tuned! Regards.
