CYCLE BY RiotWolftradingDescription of the "CYCLE" Indicator
The "CYCLE" indicator is a custom Pine Script v5 script for TradingView that visualizes cyclic patterns in price action, dividing the trading day into specific sessions and 90-minute quarters (Q1-Q4). It is designed to identify and display market phases (Accumulation, Manipulation, Distribution, and Continuation/Reversal) along with key support and resistance levels within those sessions. Additionally, it allows customization of boxes, lines, labels, and colors to suit user preferences.
Main Features
Cycle Phases:
Accumulation (1900-0100): Represents the phase where large operators accumulate positions.
Manipulation (0100-0700): Identifies potential manipulative moves to mislead retail traders.
Distribution (0700-1300): The phase where large operators distribute their positions.
Continuation/Reversal (1300-1900): Indicates whether the price continues the trend or reverses.
90-Minute Quarters (Q1-Q4):
Divides each 6-hour cycle (360 minutes) into four 90-minute quarters (Q1: 00:00-01:30, Q2: 01:30-03:00, Q3: 03:00-04:30, Q4: 04:30-06:00 UTC).
Each quarter is displayed with a colored box (Q1: light purple, Q2: light blue, Q3: light gray, Q4: light pink) and labels (defaulted to black).
Support and Resistance Visualization:
Draws boxes or lines (based on settings) showing the high and low levels of each session.
Optionally displays accumulated volume at the highs and lows within the boxes.
Daily Lines and Last 3 Boxes:
How to Use the Indicator
Step 1: Add the Indicator to TradingView
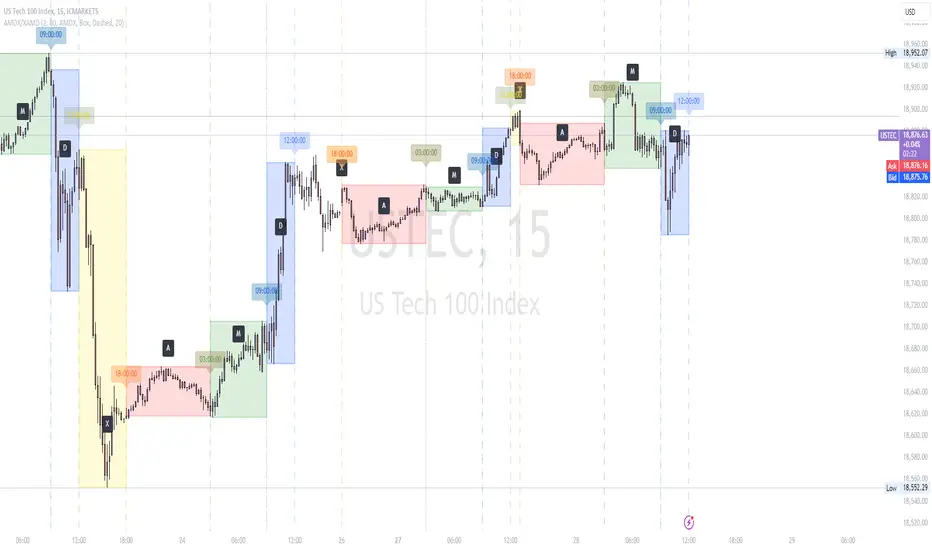
Open TradingView and select the chart where you want to apply the indicator (e.g., UMG9OOR on a 5-minute timeframe, as shown in the screenshot).
Go to the Pine Editor (at the bottom of the TradingView interface).
Copy and paste the provided code.
Click Compile and then Add to Chart.
Step 2: Configure the Indicator
Click on the indicator name on the chart ("CYCLE") and select Settings (or double-click the name).
Adjust the options based on your needs:
Cycle Phases: Enable/disable phases (Accumulation, Manipulation, Distribution, Continuation/Reversal) and adjust their time slots if needed.
90-Minute Quarters: Enable/disable quarters (Q1-Q4).
Step 3: Interpret the Indicator
Identify Cycle Phases:
Observe the red boxes indicating the phases (Accumulation, Manipulation, etc.).
The high and low levels within each phase are potential support/resistance zones.
If volume is enabled, pay attention to the accumulated volume at highs and lows, as it may indicate the strength of those levels.
Use the 90-Minute Quarters (Q1-Q4):
The colored boxes (Q1-Q4) divide the day into 90-minute segments.
Each quarter shows the price range (high and low) during that period.
Use these boxes to identify price patterns within each quarter, such as breakouts or consolidations.
The labels (Q1, Q2, etc.) help you track time and anticipate potential moves in the next quarter.
Analyze Support and Resistance:
The high and low levels of each phase/quarter act as support and resistance.
Daily lines (if enabled) show key levels from the previous day, useful for planning entries/exits.
The "last 3 boxes below price" (if enabled) highlight potential support levels the price might target.
Avoid Manipulation:
During the Manipulation phase (0100-0700), be cautious of sharp moves or false breakouts.
Use the high/low levels of this phase to identify potential traps (as explained in your first question about manipulation candles).
Step 4: Trading Strategy
Entries and Exits:
Support/Resistance: Use the high/low levels of phases and quarters to set entry or exit points.
For example, if the price bounces off a Q1 support level, consider a buy.
Breakouts: If the price breaks a high/low of a quarter (e.g., Q2), wait for confirmation to enter in the direction of the breakout.
Volume: If accumulated volume is high near a key level, that level may be more significant.
Risk Management:
Place stop-loss orders below lows (for buys) or above highs (for sells) identified by the indicator.
Avoid trading during the Manipulation phase unless you have a specific strategy to handle false breakouts.
Time Context:
Use the quarters (Q1-Q4) to plan your trades based on time. For example, if Q3 is typically volatile in your market, prepare for larger moves between 03:00-04:30 UTC.
Step 5: Adjustments and Testing
Test on Different Timeframes: The indicator is set for a 5-minute timeframe (as in the screenshot), but you can test it on other timeframes (e.g., 1-minute, 15-minute) by adjusting the time slots if needed.
Adjust Colors and Styles: If the default colors are not visible on your chart, change them for better clarity.
---
📌 1. **Accumulation: Strong Institutional Activity**
- During the **accumulation phase, we see **high volume: 82.773K, which suggests strong buying interest**, likely from institutional players.
- This sets the base for the following upward move in price.
---
📌 2. **Manipulation: False Breakout with Lower Volume**
- Later, there's a manipulation phase where price breaks above previous highs, but the volume (71.814K) is **lower than during accumulation**.
- This implies that buyers are not as aggressive as before—no real demandbehind the breakout.
- It’s likely a bull trap, where smart money is selling into the breakout to exit their positions.
---
### 📌 3. Distribution: Weakness and Lack of Demand
- The market enters a distribution phase, and volume drops even further (only 7.914K).
- Price struggles to go higher, and you start seeing rejections at the top.
- This shows that demand is drying up, and smart money is offloading positions**—not accumulating anymore.
---
### 💡 Why Take the Short Here?
- Volume is not increasing with new highs—showing weak demand**.
- The manipulation volume is weaker than the accumulation volume, confirming the breakout was likely false.
- Structure starts to break down (Q levels falling), which confirms weakness.
- This creates a high-probability short setup:
- **Entry:** after confirmation of distribution and structural breakdown.
- **Stop loss:** above the manipulation high.
- **Target:** down toward previous lows or value zones.
---
### ✅ Conclusion
Since the manipulation volume failed to exceed the accumulation volume, the breakout lacked real strength. Combined with decreasing volume in the distribution phase, this indicates fading demand and supply taking control—which justifies entering a short position.
Amdx
XAMD/AMDX ICT 01 [TradingFinder] SMC Quarterly Theory Cycles🔵 Introduction
The XAMD/AMDX strategy, combined with the Quarterly Theory, forms the foundation of a powerful market structure analysis. This indicator builds upon the principles of the Power of 3 strategy introduced by ICT, enhancing its application by incorporating an additional phase.
By extending the logic of Power of 3, the XAMD/AMDX tool provides a more detailed and comprehensive view of daily market behavior, offering traders greater precision in identifying key movements and opportunities
This approach divides the trading day into four distinct phases : Accumulation (19:00 - 01:00 EST), Manipulation (01:00 - 07:00 EST), Distribution (07:00 - 13:00 EST), and Continuation or Reversal (13:00 - 19:00 EST), collectively known as AMDX.
Each phase reflects a specific market behavior, providing a structured lens to interpret price action. Building on the fractal nature of time in financial markets, the Quarterly Theory introduces the Four Quarters Method, where a currency pair’s price range is divided into quarters.
These divisions, known as quarter points, highlight critical levels for analyzing and predicting market dynamics. Together, these principles allow traders to align their strategies with institutional trading patterns, offering deeper insights into market trends
🔵 How to Use
The AMDX framework provides a structured approach to understanding market behavior throughout the trading day. Each phase has its own characteristics and trading opportunities, allowing traders to align their strategies effectively. To get the most out of this tool, understanding the dynamics of each phase is essential.
🟣 Accumulation
During the Accumulation phase (19:00 - 01:00 EST), the market is typically quiet, with price movements confined to a narrow range. This phase is where institutional players accumulate their positions, setting the stage for future price movements.
Traders should use this time to study price patterns and prepare for the next phases. It’s a great opportunity to mark key support and resistance zones and set alerts for potential breakouts, as the low volatility makes immediate trading less attractive.
🟣 Manipulation
The Manipulation phase (01:00 - 07:00 EST) is often marked by sharp and deceptive price movements. Institutions create false breakouts to trigger stop-losses and trap retail traders into the wrong direction. Traders should remain cautious during this phase, focusing on identifying the areas of liquidity where these traps occur.
Watching for price reversals after these false moves can provide excellent entry opportunities, but patience and confirmation are crucial to avoid getting caught in the manipulation.
🟣 Distribution
The Distribution phase (07:00 - 13:00 EST) is where the day’s dominant trend typically emerges. Institutions execute large trades, resulting in significant price movements. This phase is ideal for trading with the trend, as the market provides clearer directional signals.
Traders should focus on identifying breakouts or strong momentum in the direction of the trend established during this period. This phase is also where traders can capitalize on setups identified earlier, aligning their entries with the market’s broader sentiment.
🟣 Continuation or Reversal
Finally, the Continuation or Reversal phase (13:00 - 19:00 EST) offers a critical juncture to assess the market’s direction. This phase can either reinforce the established trend or signal a reversal as institutions adjust their positions.
Traders should observe price behavior closely during this time, looking for patterns that confirm whether the trend is likely to continue or reverse. This phase is particularly useful for adjusting open positions or initiating new trades based on emerging signals.
🔵 Settings
Show or Hide Phases.
Adjust the session times for each phase :
Accumulation: 19:00-01:00 EST
Manipulation: 01:00-07:00 EST
Distribution: 07:00-13:00 EST
Continuation or Reversal: 13:00-19:00 EST
Modify Visualization : Customize how the indicator looks by changing settings like colors and transparency.
🔵 Conclusion
AMDX provides traders with a practical method to analyze daily market behavior by dividing the trading day into four key phases: Accumulation, Manipulation, Distribution, and Continuation or Reversal. Each phase highlights specific market dynamics, offering insights into how institutional activity shapes price movements.
From the quiet buildup in the Accumulation phase to the decisive trends of the Distribution phase, and the critical transitions in Continuation or Reversal, this approach equips traders with the tools to anticipate movements and make informed decisions.
By recognizing the significance of each phase, traders can avoid common traps during Manipulation, capitalize on clear trends during Distribution, and adapt to changes in the final phase of the day.
The structured visualization of market phases simplifies decision-making for traders of all levels. By incorporating these principles into your trading strategy, you can enhance your ability to align with market trends, optimize entry and exit points, and achieve more consistent results in your trading journey.
AMDX/XAMD indicatorThe AMDX/XAMD indicator is designed to highlight specific trading sessions on the chart using distinct colors and optional vertical lines. Users can choose between two session types, AMDX or XAMD, and customize the visual appearance of the sessions. This tool is particularly useful for traders who want to analyze market behavior during different trading periods.
Meaning of AMDX:
A: Accumulation
M: Manipulation
D: Distribution
X: Continuation Or Reversal
Features:
Session Highlighting:
AMDX Sessions: Split into four segments - A, M, D, X.
XAMD Sessions: Split into four segments - X, A, M, D.
Customizable Colors:
Choose individual colors for each session (A, M, D, X).
Adjust the transparency of the session boxes for better visual integration with the chart.
Drawing Styles:
Box Style: Draws colored boxes around the session ranges.
Line Style: Draws vertical lines at session start and end times.
Vertical Lines:
Option to enable or disable vertical lines at session boundaries.
Customizable line style: Solid, Dotted, or Dashed.
Session Labels:
Automatically labels each session for easy identification.
Customization Options:
Session Type: Select between AMDX and XAMD session types.
Colors: Set custom colors for each session and vertical lines.
Border Width: Adjust the width of the session box borders.
Transparency: Control the transparency level of the session boxes.
Drawing Style: Choose between Box and Line styles for session representation.
Vertical Lines: Enable or disable vertical lines and select the line style.
How It Works:
The indicator calculates the start and end times for each session based on the selected session type (AMDX or XAMD). It then draws either boxes or lines to highlight these sessions on the chart. The indicator also includes options to draw vertical lines at the session boundaries and labels each session with a corresponding letter (A, M, D, X).
Use Cases:
Market Session Analysis: Easily identify and analyze market behavior during different trading sessions.
Intraday Trading: Helps intraday traders to focus on specific time segments of the trading day.
Visual Segmentation: Provides a clear visual segmentation of the trading day, aiding in better decision-making.
Times for AMDX/XAMD session:
A Session: 18:00 (previous day) to 03:00 (current day)
M Session: 03:00 to 09:00
D Session: 09:00 to 12:00
X Session: 12:00 to 18:00
Time for the XAMD session :
X Session: 18:00 (previous day) to 00:00 (current day)
A Session: 00:00 to 09:00
M Session: 09:00 to 12:00
D Session: 12:00 to 18:00