52SIGNAL RECIPE AMA Momentum Vector═══52SIGNAL RECIPE AMA Momentum Vector═══
◆ Overview
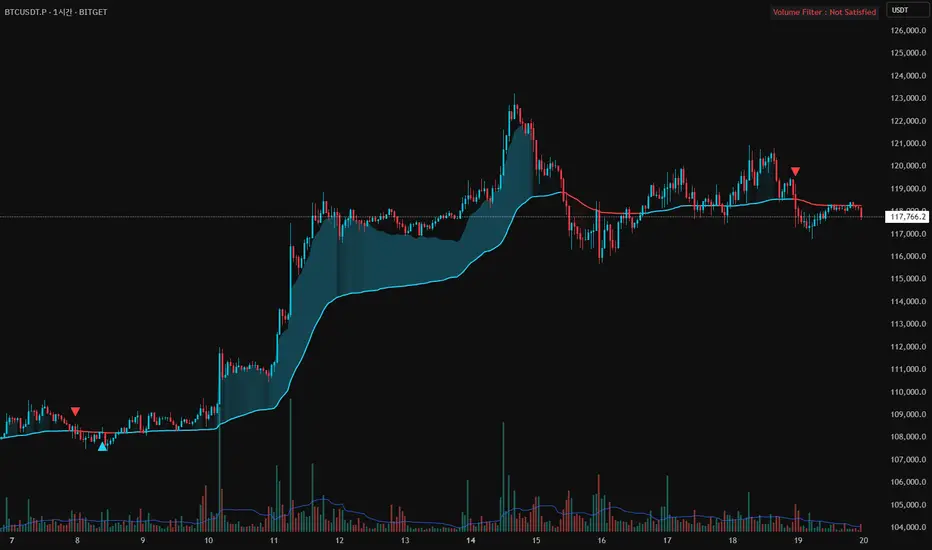
52SIGNAL RECIPE AMA Momentum Vector is an advanced technical indicator based on Adaptive Moving Average (AMA), integrating volume filtering and gradient zone visualization to provide comprehensive analysis of price trends and momentum.
It automatically adjusts to market conditions by calculating efficiency ratios, reducing noise while clearly capturing significant trends. The volume confirmation system helps traders identify high-probability entry and exit points with precision.
─────────────────────────────────────
◆ Key Features
• Adaptive Moving Average: Smart moving average that automatically adjusts based on market conditions
• Volume Filter Integration: Double-confirmation of important price movements through volume analysis
• Momentum Gradient Zones: Intuitive visualization of trend strength through color gradation
• Signal Confirmation System: Generation of high-reliability buy/sell signals by combining multiple factors
• Trend Direction Identification: Clear color distinction between bullish and bearish market conditions
• Automatic Adaptation: Intelligent design that self-adjusts to various market situations
─────────────────────────────────────
◆ Technical Foundation
■ AMA Calculation Principles
• Efficiency Ratio (ER): Measures how efficiently price moves in one direction
• Dynamic Smoothing Coefficient: Automatically adjusts faster or slower based on market conditions
• Adaptive Algorithm: Less sensitive during sideways markets, more responsive during trending markets
• Noise Reduction Function: Filters out meaningless price movements while capturing important signals
■ Momentum Vector Implementation
• Trend-Price Distance Calculation: Measures trend strength by the distance between AMA and current price
• Color Gradation: Visual system where color intensity changes proportionally to trend strength
• ATR-Based Adjustment: Automatically adjusts gradient zone width according to market volatility
• Directional Color Distinction: Intuitive display with blue/cyan for uptrends and red for downtrends
─────────────────────────────────────
◆ Practical Applications
■ Price Trend Interpretation
• Trend Direction Assessment:
▶ Price above AMA with blue gradation indicates ongoing bullish momentum
▶ Price below AMA with red gradation indicates ongoing bearish momentum
• Momentum Strength Verification:
▶ Deeper gradient colors mean stronger momentum and healthier trends
▶ Lighter gradient colors suggest weakening momentum and potential reversal
■ Trading Strategy Utilization
• Trend Following Strategy:
▶ Buy signal when price crosses above AMA with increased volume
▶ Sell signal when price crosses below AMA with increased volume
• Momentum Confirmation Trading:
▶ Deep gradation increases confidence in trend continuation for entry decisions
▶ Multiple consecutive candles staying on one side of AMA increases trend reliability
─────────────────────────────────────
◆ Advanced Configuration Options
■ Input Parameter Guide
• Fast Period (Default: 2)
▶ 1-2: Responds very quickly to price changes. Suitable for short-term trading.
▶ 3-5: Moderate response that reduces frequent signals.
▶ 6-10: Slower response but captures only more definitive trends.
• Slow Period (Default: 30)
▶ 20-25: AMA moves faster. Good for shorter timeframe trading.
▶ 26-35: Balanced speed suitable for most market conditions.
▶ 36-50: AMA moves slowly, smoothly following long-term trends.
• Efficiency Ratio Period (Default: 10)
▶ 5-8: Focuses more on recent price movements. Responds quickly to changes.
▶ 9-12: Balanced period suitable for most situations.
▶ 13-20: Considers longer-term price movements, ignoring temporary fluctuations.
• Volume Average Period (Default: 20)
▶ 10-15: Compares with the average volume of the last 10-15 days. More sensitive to changes.
▶ 16-25: Compares with the average volume of approximately the last month. Balanced setting.
▶ 26-50: Compares with long-term average volume, capturing only truly significant volume changes.
• Volume Threshold Multiplier (Default: 1.2)
▶ 1.0-1.1: Recognizes volume just 10% above average as valid.
▶ 1.2-1.5: Requires volume 20-50% higher than average (e.g., 1.2 means 120% of average).
▶ 1.6-2.0: Recognizes only very high volume at least 1.6 times (160%) above average.
■ Timeframe-Specific Recommended Settings
• Short Timeframes (5min-1hr):
Fast Period 2, Slow Period 20, Efficiency Ratio Period 8
→ Responds quickly to price changes, suitable for day trading.
• Medium Timeframes (4hr-daily):
Fast Period 2, Slow Period 30, Efficiency Ratio Period 10
→ Most balanced setting for general swing trading.
• Long Timeframes (daily-weekly):
Fast Period 2, Slow Period 40, Efficiency Ratio Period 14
→ Optimized for smoothly tracking longer trends.
■ Market-Specific Recommended Settings
• Stock Market:
Volume Threshold 1.2, Volume Average Period 20
→ Signal is valid when volume is 20% above average.
• Forex Market:
Volume Threshold 1.5, Efficiency Ratio Period 12
→ Forex requires higher volume to be meaningful and slightly longer efficiency measurement.
• Cryptocurrency Market:
Volume Threshold 1.3, Fast Period 2, Slow Period 25
→ Settings optimized for highly volatile cryptocurrencies.
─────────────────────────────────────
◆ Synergy with Other Indicators
• Moving Averages: Trend reliability increases when AMA and key moving averages point in the same direction
• RSI/Stochastic: Powerful reversal signals when AMA crossovers occur in overbought/oversold zones
• MACD: Signal probability greatly increases when MACD histogram direction changes coincide with AMA crossovers
• Bollinger Bands: Trend strength can be determined by AMA's position within Bollinger Bands
• Support/Resistance Levels: Success probability dramatically increases when AMA breakouts occur at key price levels
─────────────────────────────────────
◆ Conclusion
AMA Momentum Vector provides accurate price trend analysis by combining the advanced features of adaptive moving averages with momentum visualization technology.
It perfectly adapts to constantly changing market environments through its self-adjusting algorithm and generates highly reliable trading signals through its volume confirmation system.
Users can optimize the indicator for their trading style and market conditions with simple parameter adjustments, enabling effective trading decisions that comprehensively consider price direction, momentum strength, and volume confirmation.
─────────────────────────────────────
※ Disclaimer: Past performance does not guarantee future results. Always use appropriate risk management strategies.
═══52SIGNAL RECIPE AMA Momentum Vector═══
◆ 개요
52SIGNAL RECIPE AMA Momentum Vector는 적응형 이동평균(AMA)을 기반으로 한 고급 기술적 지표로, 볼륨 필터링과 그라데이션 존 시각화를 통합하여 가격 추세와 모멘텀을 종합적으로 분석합니다.
시장 효율성 비율을 자동으로 계산하여 시장 상황에 맞게 스스로 조정되며, 노이즈는 줄이고 중요한 추세는 선명하게 포착합니다. 또한 볼륨 확인 시스템을 통해 높은 확률의 매매 시점을 정확하게 식별할 수 있도록 도와줍니다.
─────────────────────────────────────
◆ 주요 특징
• 적응형 이동평균: 시장 상황에 따라 자동으로 조정되는 스마트한 이동평균선
• 볼륨 필터 통합: 중요한 가격 움직임을 볼륨으로 한번 더 확인
• 모멘텀 그라데이션 존: 색상 그라데이션으로 추세의 강도를 직관적으로 시각화
• 신호 확인 시스템: 여러 요소를 종합하여 신뢰도 높은 매수/매도 신호 생성
• 추세 방향 식별: 상승세와 하락세를 색상으로 명확하게 구분
• 자동 적응 기능: 다양한 시장 상황에 알아서 맞춰지는 지능형 설계
─────────────────────────────────────
◆ 기술적 기반
■ AMA 계산 원리
• 효율성 비율 (ER): 가격이 얼마나 효율적으로 한 방향으로 움직이는지 측정
• 동적 평활화 계수: 시장 상황에 따라 빠르거나 느리게 자동 조절되는 계수
• 적응형 알고리즘: 횡보장에서는 둔감하게, 추세장에서는 민감하게 반응
• 노이즈 감소 기능: 무의미한 가격 움직임은 걸러내고 중요한 신호만 포착
■ 모멘텀 벡터 구현
• 추세-가격 거리 계산: AMA와 현재 가격 사이의 거리로 추세 강도 측정
• 색상 그라데이션: 추세 강도에 비례하여 색상 농도가 변하는 시각화 시스템
• ATR 기반 조정: 시장 변동성에 맞춰 그라데이션 영역 너비 자동 조절
• 방향성 색상 구분: 상승세는 파란색/청록색, 하락세는 빨간색으로 직관적 표시
─────────────────────────────────────
◆ 실용적 응용
■ 가격 추세 해석
• 추세 방향 판단:
▶ 가격이 AMA 위에 있고 파란색 그라데이션이 보이면 상승 모멘텀 진행 중
▶ 가격이 AMA 아래에 있고 빨간색 그라데이션이 보이면 하락 모멘텀 진행 중
• 모멘텀 강도 확인:
▶ 그라데이션 색상이 진할수록 모멘텀이 강하고 추세가 건강함을 의미
▶ 그라데이션 색상이 옅을수록 모멘텀이 약해지고 있으며 반전 가능성 시사
■ 트레이딩 전략 활용
• 추세 추종 전략:
▶ 가격이 AMA를 상향 돌파하고 볼륨이 증가하면 매수 신호
▶ 가격이 AMA를 하향 돌파하고 볼륨이 증가하면 매도 신호
• 모멘텀 확인 트레이딩:
▶ 진한 그라데이션은 추세 지속 가능성이 높음을 의미하므로 진입 확신 강화
▶ 여러 캔들이 연속해서 AMA 한쪽에 머물면 추세의 신뢰도가 높아짐
─────────────────────────────────────
◆ 고급 설정 옵션
■ 인풋 파라미터 가이드
• 빠른 기간 (Fast Period) (기본값: 2)
▶ 1-2: 가격 변화에 매우 빠르게 반응합니다. 단기 거래에 적합합니다.
▶ 3-5: 적당히 반응하여 잦은 신호를 줄여줍니다.
▶ 6-10: 반응이 느리지만 더 확실한 추세만 포착합니다.
• 느린 기간 (Slow Period) (기본값: 30)
▶ 20-25: AMA가 더 빠르게 움직입니다. 짧은 시간 거래에 좋습니다.
▶ 26-35: 균형 잡힌 속도로 대부분의 시장 상황에 적합합니다.
▶ 36-50: AMA가 천천히 움직여 장기 추세를 부드럽게 따라갑니다.
• 효율성 비율 기간 (Efficiency Ratio Period) (기본값: 10)
▶ 5-8: 최근 가격 움직임에 더 집중합니다. 변화에 빠르게 반응합니다.
▶ 9-12: 균형 잡힌 기간으로 대부분의 상황에 적합합니다.
▶ 13-20: 더 긴 기간의 가격 움직임을 고려하여 일시적인 변동을 무시합니다.
• 볼륨 평균 기간 (Volume Average Period) (기본값: 20)
▶ 10-15: 최근 10-15일의 평균 볼륨과 비교합니다. 변화에 민감합니다.
▶ 16-25: 지난 약 한 달간의 평균 볼륨과 비교합니다. 균형 잡힌 설정입니다.
▶ 26-50: 장기 평균 볼륨과 비교하여 정말 큰 볼륨 변화만 포착합니다.
• 볼륨 임계값 승수 (Volume Threshold Multiplier) (기본값: 1.2)
▶ 1.0-1.1: 평균보다 약 10% 정도만 높아도 유효한 볼륨으로 인정합니다.
▶ 1.2-1.5: 평균보다 20~50% 높은 볼륨을 요구합니다(예: 1.2는 평균의 120%).
▶ 1.6-2.0: 평균의 최소 1.6배(160%) 이상 되는 매우 높은 볼륨만 인정합니다.
■ 타임프레임별 추천 설정
• 짧은 시간 차트 (5분-1시간):
빠른 기간 2, 느린 기간 20, 효율성 비율 기간 8
→ 가격 변화에 빠르게 반응하며 단타에 적합합니다.
• 중기 차트 (4시간-일봉):
빠른 기간 2, 느린 기간 30, 효율성 비율 기간 10
→ 일반적인 스윙 트레이딩에 가장 균형 잡힌 설정입니다.
• 장기 차트 (일봉-주봉):
빠른 기간 2, 느린 기간 40, 효율성 비율 기간 14
→ 더 긴 추세를 매끄럽게 추적하는 데 최적화되었습니다.
■ 시장별 추천 설정
• 주식 시장:
볼륨 임계값 1.2, 볼륨 평균 기간 20
→ 평균보다 20% 많은 볼륨이 있을 때 신호가 유효합니다.
• 외환 시장:
볼륨 임계값 1.5, 효율성 비율 기간 12
→ 외환은 볼륨이 더 높아야 의미가 있으며, 약간 더 긴 효율성 측정이 필요합니다.
• 암호화폐 시장:
볼륨 임계값 1.3, 빠른 기간 2, 느린 기간 25
→ 변동성이 큰 암호화폐에 최적화된 설정입니다.
─────────────────────────────────────
◆ 다른 지표와의 시너지
• 이동평균선: AMA와 주요 이동평균선이 같은 방향을 가리킬 때 추세 신뢰도 상승
• RSI/스토캐스틱: 과매수/과매도 구간에서 AMA 교차 발생 시 강력한 반전 신호
• MACD: MACD 히스토그램 방향 변화와 AMA 교차가 일치하면 신호 확률 대폭 증가
• 볼린저 밴드: AMA가 볼린저 밴드 내에서 어떤 위치에 있는지로 추세 강도 판단
• 지지/저항 레벨: 중요 가격대에서 AMA 돌파 시 성공 확률이 크게 증가
─────────────────────────────────────
◆ 결론
AMA Momentum Vector는 적응형 이동평균의 고급 기능과 모멘텀 시각화 기술을 결합하여 정확한 가격 추세 분석을 제공합니다.
자체 조정 알고리즘으로 시시각각 변하는 시장 환경에 완벽하게 적응하며, 볼륨 확인 시스템을 통해 신뢰도 높은 매매 신호를 생성합니다.
사용자는 간단한 파라미터 조정으로 자신의 거래 스타일과 시장 상황에 맞게 지표를 최적화할 수 있어, 가격 방향, 모멘텀 강도, 볼륨 확인을 종합적으로 고려한 효과적인 거래 결정을 내릴 수 있습니다.
─────────────────────────────────────
※ 면책 조항: 과거 성과가 미래 결과를 보장하지 않습니다. 항상 적절한 리스크 관리 전략을 사용하세요.
AMA
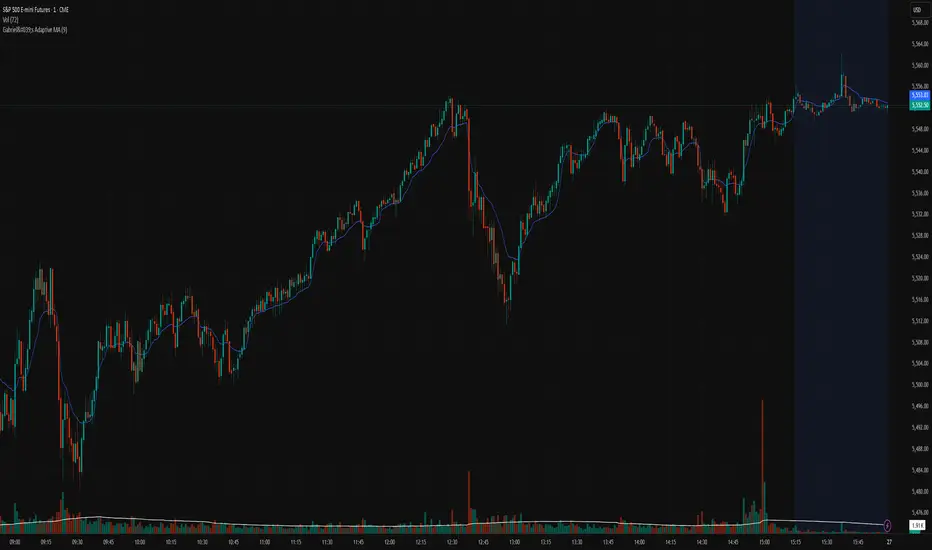
Gabriel's Adaptive MA📜 Gabriel's Adaptive MA — Indicator Description
Gabriel's Adaptive Moving Average (GAMA) is a dynamic trend-following indicator that intelligently adjusts its smoothing based on both trend strength and market volatility.
It is designed to provide faster responsiveness during strong moves while maintaining stability during choppy or consolidating periods.
🧠 What it does:
This indicator plots a custom-built, highly dynamic Moving Average that adapts itself intelligently based on:
Trend Strength (via Perry Kaufman's Efficiency Ratio)
Market Volatility (via Tushar Chande's Volatility Ratio)
It reacts faster when the market is trending strongly and/or highly volatile,
and it smooths out and slows down when the market is choppy or calm.
🔍 How it works (step-by-step):
1. User Inputs:
length: (default 14)
How many bars to look back for calculations.
fastSC: Fastest possible smoothing constant (hardcoded as 2 / (2+1))
slowSC: Slowest possible smoothing constant (hardcoded as 2 / (30+1))
(These are used to control how fast/slow the KAMA can react.)
2. Calculate Trendiness — Kaufman Efficiency Ratio (ER):
Net Change = Absolute difference between current close and close from length bars ago.
Sum of Absolute Changes = Sum of absolute price changes between every bar inside the length window.
Efficiency Ratio (ER) = Net Change divided by Sum of Changes.
✅ If ER is close to 1 → Smooth, trending market.
✅ If ER is close to 0 → Choppy, sideways market.
3. Calculate Bumpiness — Volatility Ratio (VR):
Short-Term Volatility = Standard deviation of close over length.
Long-Term Volatility = Standard deviation of close over length * 2.
Volatility Ratio (VR) = Short-Term Volatility divided by Long-Term Volatility.
✅ If VR is >1 → Market is becoming more volatile recently.
✅ If VR is <1 → Market is calming down.
4. Create the Hybrid Alpha:
Multiply ER × VR.
Then square the result (math.pow(..., 2)).
This hybrid alpha decides how aggressive the MA should be based on both trend and volatility.
If ER and VR are both strong → big alpha → fast movement.
If ER and/or VR are weak → small alpha → slow movement.
5. Calculate the Final Adaptive Smoothing Constant (hybridSC):
hybridSC = slowSC + hybridAlpha × (fastSC - slowSC)
This smoothly interpolates between the slowest and fastest smoothing depending on market conditions.
6. Calculate and Plot the Adaptive MA:
The moving average is manually calculated:
hybridMA := na(hybridMA ) ? close : hybridMA + hybridSC * (close - hybridMA )
It behaves like an EMA but with dynamic smoothing, not a fixed alpha.
✅ If hybridSC is high → MA hugs the price closely.
✅ If hybridSC is low → MA stays smooth and resists noise.
Finally, it plots this Adaptive MA on the chart in blue color.
📊 Visual Summary
Market Type What Happens to GAMA
Trending hard + volatile Follows price quickly
Trending hard + calm Follows steadily but carefully
Sideways + volatile Reacts carefully (won't chase noise)
Sideways + calm Smooths heavily (avoids fakeouts)
✨ Main Strengths:
Adapts automatically without you tuning settings manually every time market changes.
Responds smartly to both trend quality (ER) and market energy (VR).
Reduces lag during real moves.
Filters out false signals during choppy mess.
🧪 Key Innovation compared to normal MAs:
Traditional MA Gabriel's Adaptive MA
Same smoothing every bar Dynamic smoothing every bar
Slow during fast moves Adapts fast during real moves
No understanding of volatility or trendiness Full market sensitivity
⚡ **Simple One-Line Description:**
"Gabriel's Adaptive MA is a dynamic, trend-and-volatility-sensitive moving average that intelligently adjusts its speed to match market conditions."
Three Anchored Moving Averages (VWAP / SMA / EMA)
This indicator allows users to anchor three types of moving averages (Simple Moving Average (SMA), Exponential Moving Average (EMA), and Volume Weighted Average Price (VWAP)) to specific points in time (anchor points)
Key Features:
Select from three Moving Average Types:
Simple Moving Average (SMA): Averages the closing prices over a specified period.
Exponential Moving Average (EMA): Gives more weight to recent prices, making it more responsive to new information.
Volume Weighted Average Price (VWAP): Averages the price weighted by volume, useful for understanding the average price at which the asset has traded over a period.
Up to Three Anchor Points:
Users can set up to three different anchor points to calculate the moving averages from specific dates and times. This allows for analysis of price action starting from significant points or specific events. For example, you can anchor to the low and high of a move to identify key levels or to points where the price takes off from a previous anchored MA.
Customisable Sentiment Options:
Each anchor point can be associated with a sentiment input (Auto, Bull, Bear, None), which influences if the MAs are displayed as lines or zones/bands:
Auto: Automatically determines the sentiment based on whether anchor points are on pivot highs and lows. If anchored to a pivot high, the system will assume a bearish sentiment and display a red band or zone between the MA OHLC4 and High. Anchoring to a pivot low will display a green band (OHLC4 - Low).
Bull: Forces a bullish sentiment (Green Band - OHLC4 to Low)
Bear: Forces a bearish sentiment (Red Band - OHLC4 to High)
None: Ignores sentiment and displays a single line (OHLC4)
Chart Matching:
The indicator includes an option to display the moving averages only if the chart symbol matches a specified ticker. This feature ensures that the indicator is relevant to the specific asset being analysed.
How to Use the Indicator:
1. Set Anchor Points: When added to your chart, select three anchor points by point and click. If you only wish to anchor to a single point, click on that point three times and disable the other two in settings once the indicator is applied.
2. Select Moving Average Type: Choose between SMA, EMA, or VWAP using the dropdown menu. EMAs are the most responsive.
3. Enable/Disable Anchor Points: Use the checkboxes to enable or disable each anchor point.
4. Select Sentiment Type: Choose between Auto, Bull, Bear, or None.
5. Chart Matching: Optionally, specify a chart symbol to restrict the indicator's display to that particular asset.
6. Interpret the Plots: The indicator plots the high, mid, and low values of the selected moving average type from each anchor point. The fills between these plots help identify potential support and resistance zones. These should be used as points of interest for pullback reversals or potential continuation if the price breaks through.
Practical Applications:
Trend Analysis: Identify the overall trend direction from specific historical points.
Support and Resistance: Determine key dynamic support and resistance levels based on anchored moving averages.
Event-Based Analysis: Anchor the moving averages to significant events (e.g., earnings releases, economic data) to study their impact on price trends.
Multi Timeframe Analysis: Higher Timeframe Anchors can be used to identify longer term trend analysis. Switching to a lower timeframe for execution triggers at these points wont distort the MA levels as they are anchored to a specific point in time
Intraday or Swing Trading: trend analysis using anchor points can be used for any style of trading (Intraday / Swing / Invest). Use anchored levels as points of interest and wait for hints in price action to try and catch the next move.

Adaptive Moving Average (AMA) Signals (Zeiierman)█ Overview
The Adaptive Moving Average (AMA) Signals indicator, enhances the classic concept of moving averages by making them adaptive to the market's volatility. This adaptability makes the AMA particularly useful in identifying market trends with varying degrees of volatility.
The core of the AMA's adaptability lies in its Efficiency Ratio (ER), which measures the directionality of the market over a given period. The ER is calculated by dividing the absolute change in price over a period by the sum of the absolute differences in daily prices over the same period.
⚪ Why It's Useful
The AMA Signals indicator is particularly useful because of its adaptability to changing market conditions. Unlike static moving averages, it dynamically adjusts, providing more relevant signals that can help traders capture trends earlier or identify reversals with greater accuracy. Its configurability makes it suitable for various trading strategies and timeframes, from day trading to swing trading.
█ How It Works
The AMA Signals indicator operates on the principle of adapting to market efficiency through the calculation of the Efficiency Ratio (ER), which measures the directionality of the market over a specified period. By comparing the net price change to total price movements, the AMA adjusts its sensitivity, becoming faster during trending markets and slower during sideways markets. This adaptability is enhanced by a gamma parameter that filters signals for either trend continuation or reversal, making it versatile across different market conditions.
change = math.abs(close - close )
volatility = math.sum(math.abs(close - close ), n)
ER = change / volatility
Efficiency Ratio (ER) Calculation: The AMA begins with the computation of the Efficiency Ratio (ER), which measures the market's directionality over a specified period. The ER is a ratio of the net price change to the total price movements, serving as a measure of the efficiency of price movements.
Adaptive Smoothing: Based on the ER, the indicator calculates the smoothing constants for the fastest and slowest Exponential Moving Averages (EMAs). These constants are then used to compute a Scaled Smoothing Coefficient (SC) that adapts the moving average to the market's efficiency, making it faster during trending periods and slower in sideways markets.
Signal Generation: The AMA applies a filter, adjusted by a "gamma" parameter, to identify trading signals. This gamma influences the sensitivity towards trend or reversal signals, with options to adjust for focusing on either trend-following or counter-trend signals.
█ How to Use
Trend Identification: Use the AMA to identify the direction of the trend. An upward moving AMA indicates a bullish trend, while a downward moving AMA suggests a bearish trend.
Trend Trading: Look for buy signals when the AMA is trending upwards and sell signals during a downward trend. Adjust the fast and slow EMA lengths to match the desired sensitivity and timeframe.
Reversal Trading: Set the gamma to a positive value to focus on reversal signals, identifying potential market turnarounds.
█ Settings
Period for ER calculation: Defines the lookback period for calculating the Efficiency Ratio, affecting how quickly the AMA responds to changes in market efficiency.
Fast EMA Length and Slow EMA Length: Determine the responsiveness of the AMA to recent price changes, allowing traders to fine-tune the indicator to their trading style.
Signal Gamma: Adjusts the sensitivity of the filter applied to the AMA, with the ability to focus on trend signals or reversal signals based on its value.
AMA Candles: An innovative feature that plots candles based on the AMA calculation, providing visual cues about the market trend and potential reversals.
█ Alerts
The AMA Signals indicator includes configurable alerts for buy and sell signals, as well as positive and negative trend changes.
-----------------
Disclaimer
The information contained in my Scripts/Indicators/Ideas/Algos/Systems does not constitute financial advice or a solicitation to buy or sell any securities of any type. I will not accept liability for any loss or damage, including without limitation any loss of profit, which may arise directly or indirectly from the use of or reliance on such information.
All investments involve risk, and the past performance of a security, industry, sector, market, financial product, trading strategy, backtest, or individual's trading does not guarantee future results or returns. Investors are fully responsible for any investment decisions they make. Such decisions should be based solely on an evaluation of their financial circumstances, investment objectives, risk tolerance, and liquidity needs.
My Scripts/Indicators/Ideas/Algos/Systems are only for educational purposes!

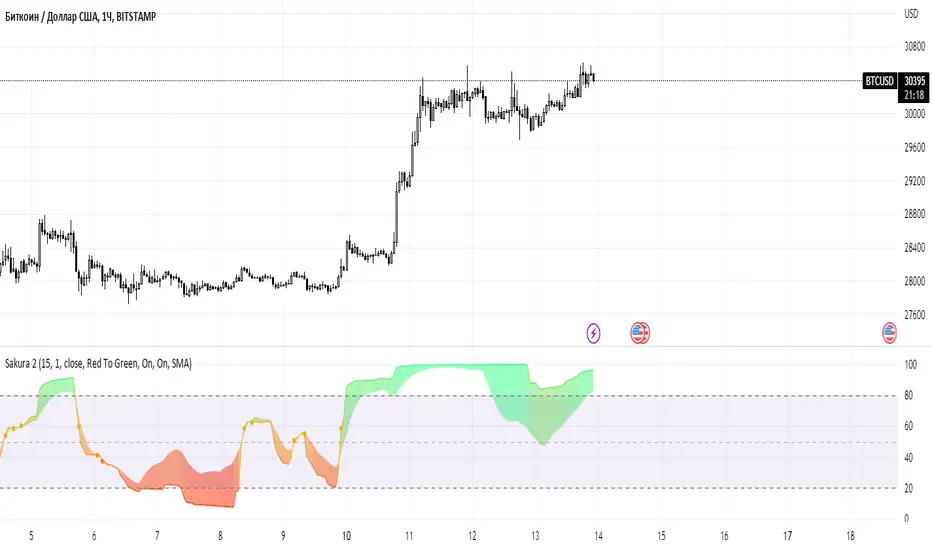
Sakura 2The oscillator uses an adaptive moving average as input to another RSI oscillator and is designed to provide a way to minimize the impact of corrections on the output of the oscillator without significant lag.
An additional trigger line is present in order to provide entry points from intersections between the oscillator and the trigger line.
I'll be working on the code to add and describe the privileges and the best settings
Settings
=Lengthy : period of the oscillator
=Power : controls the sensitivity of the oscillator to retracements, with higher values minimizing the sensitivity to retracements.
=Src : source input of the indicator
The indicator also includes the following graphical settings:
=Gradient : Determines the color mode to use for the gradient, options include "Red To Green", "Red To Blue" and "None", with "None" displaying no gradient.
=Color fill : Determines whether to fill the area between the oscillator and the trigger line or not, by default "On".
=Circles : Determines whether to show circles highlighting the crosses between the oscillator and the trigger line.
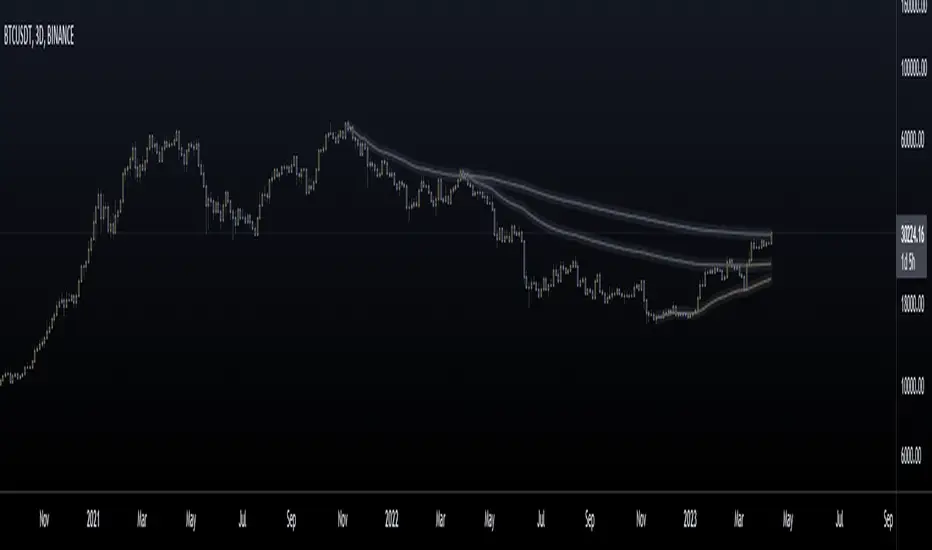
Anchored Moving Averages - InteractiveWhat is an Anchored Moving Average?
An anchored moving average (AMA) is created when you select a point on the chart and start calculating the moving average from there.
Thus the moving average’s denominator is not fixed but cumulative and dynamic. It is similar to an Anchored VWAP, but neglecting the volume data, which may be useful when this data is not reliable and you want to focus just on price.
Main Features
This interactive indicator allows you to select 3 different points in time to plot their respective moving averages. As soon as you add the indicator to your chart you will be asked to click on the 3 different points where you want to start the calculation for each moving average.
Each AMA (Anchored Moving Average) will be colored according to its slope, using a gradient defined by two user chosen colors in the indicator menu.
The default source for the calculation is the pivot price (HLC3) but can also be modified in the menu.
Examples:
Enjoy!
Better Heiken-Ashi Candles w/ Expanded Source Types [Loxx]Better Heiken-Ashi Candles w/ Expanded Source Types is an indicator to compare regular candles to traditional Heiken-Ashi candles to "better" Heiken Ashi candles. This indicator and comparison study appears an oscillator. The purpose of this indicator is to demonstrate a better way to calculate HA candles and also to demonstrate expanded source types. This indicator is meant to be used by advanced Pine Coders who wish to add fine-tuning to their indicators and strategies.
What are Heiken Ashi "better" candles?
The "better formula" was proposed in an article/memo by BNP-Paribas (In Warrants & Zertifikate, No. 8, August 2004 (a monthly German magazine published by BNP Paribas, Frankfurt), there is an article by Sebastian Schmidt about further development (smoothing) of Heikin-Ashi chart.)
They proposed to use the following :
(Open+Close)/2+(((Close-Open)/(High-Low))*ABS((Close-Open)/2))
instead of using :
haClose = (O+H+L+C)/4
According to that document the HA representation using their proposed formula is better than the traditional formula.
What are traditional Heiken-Ashi candles?
The Heikin-Ashi technique averages price data to create a Japanese candlestick chart that filters out market noise.
Heikin-Ashi charts, developed by Munehisa Homma in the 1700s, share some characteristics with standard candlestick charts but differ based on the values used to create each candle. Instead of using the open, high, low, and close like standard candlestick charts, the Heikin-Ashi technique uses a modified formula based on two-period averages. This gives the chart a smoother appearance, making it easier to spots trends and reversals, but also obscures gaps and some price data.
What's going on with this indicator?
- First, we have the options to select the candlestick type: Regular, HA, HA Better
- Next, and to demonstrate the expanded source types, I've added a simple moving average. In the drop down for the SMA source you'll notice something very different from the typical TradingView source selector. Here's how to decode the new names for the sources:
Close = close
Open = open
High = high
Low = low
Median = hl2
Typical = hlc3
Weighted = hlcc4
Average = ohlc4
Average Median Body = (open+close)/2
Trend Biased = (see code, too complex to explain here)
Trend Biased (extreme) = (see code, too complex to explain here)
... for HA and HA better, see the same set up as above but with different open and close values to calcualate the other source types
- For the HA better calculations, we run the close value through either an Adaptive, Kaufman, or T3 smoothing filter. The length for these smoothing filters, either 2 or 3, can be found in the code and is a constant value that shouldn't be changed. This smoothing is in inline with what is described in the article mentioned above
- Lastly, I've placed an SMA over the oscillator so that the user can test out the various sources explained above
Included:
- Toggle on/off bar coloring

Ehlers Mother Of Adaptive Moving Averages [CC]The Mother Of Adaptive Moving Averages was created by John Ehlers (Rocket Science For Traders pgs 182-183) and this is definitely my favorite Ehlers moving average script. This works as a trend indicator and a typical moving average. When the mama is above the fama then the stock is in an uptrend and vice versa. Of course it is also good when the price is above the fama and mama lines. Buy when the indicator line is green and sell when it is red.
Let me know if there are other indicator scripts you would like to see me publish or if you want something custom done!

[LunaOwl] 11 kinds of Adaptive MA Model作品: 11種自適應性平滑模型
It integrates eleven kinds of adaptive moving average method. At first, I just wanted to make a ATR. Later, the price series ±N*ATR mult, to form two series. Then use the concept of support/resistance breakthrough to design it, and then two adaptive series formation channels were formed. Take the average of the two series as the signal. When the price crosses the signal, it's judged to be long or short.
整合了十一種能夠自適應性的移動平均模型。起初只是想要做一個基本款ATR指標,後來將價格加減N個ATR倍數,形成兩條序列形成通道,再使用支撐阻力突破的概念去設計它,再形成兩條自適應性的序列形成通道,再取中間值當成信號。當價格與信號交叉,則判斷作多或者作空。
--------------------------*
Parameter 設置參數
Resolution: The default is "the same as the variety". Is a named constant for resolution input type of input function.
商品分辨率:預設與品種相同。是input函數的時間周期輸入類型的命名常量。
Smoothing: The default is Recursive Moving Average(RMA). It can choose other methods, the table is as follows.
平滑類型:預設是「遞回平均」,可以選擇其它方法,列表如下。
列表 / The table of moving averages is as follows:
//****中英對照表*****##______________________________________
1. 遞回平均 || Recursive Moving Average
2. 簡單平均 || Simple Moving Average
3. 指數平均 || Exponential Moving Average
4. 加權平均 || Weighted Moving Average
5. 船體平均 || Hull Moving Average
6. 成交量加權 || Volume Weighted Moving Average
7. 對稱加權 || Symmetric Weighted Moving Average
8. 雙重指數 || Double Exponential Moving Average
9. 三重指數 || Triple Exponential Moving Average
10. 高斯分佈 || Arnaud Legoux Moving Average
11. 提爾森T3 || Tillson T3 Moving Average
//##_________________________________________________________
Candle Mode: There are three versions, original, two-color and four-color.
燭台模式:預設模式只區分趨勢,可以改成原版蠟燭或四種顏色版本。
Length: The default is 14, usually no need to adjust.
平滑期數:預設值是14,基本上不用理它。
Occurrence: The default is 1. The range is 0~10. The larger the value, the more delayed. If zero will become too sensitive and noise.
滯後性:預設值是1。調整範圍是0~10,數值愈大信號愈延遲,如果值為0,會變得過於敏捷,那將會失去平滑的意義。
N multiple: The default is 0.618, can be set to 1. The range is 0.382~3.000.
倍數N:預設值是0.618,也可以設定1,最低是0.382,最大是3。
--------------------------*
1. Candle Mode can set the original candle, cancel candle trend color changes. However, the background will still be filled.
可以設定顯示原版的蠟燭線,背景與線並不會消失。
2. Four-color version of candles. It shows changes in trends and prices.
四色版本的蠟燭線,可以顯示趨勢與每日收盤價的變化。

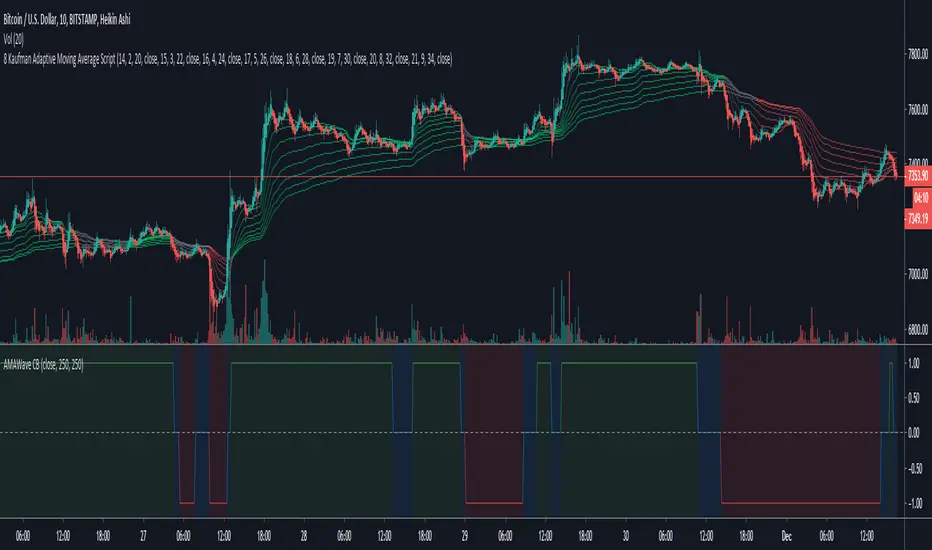
Kaufman AMA Binary Wave [ChuckBanger]This is Kaufman AMA Binary Wave with buy and sell zones. It’s pretty simple: when the line is over zero = buy zone, below zero = sell, at zero = neutral. You can experiment with the filter and length settings to suit your environment.
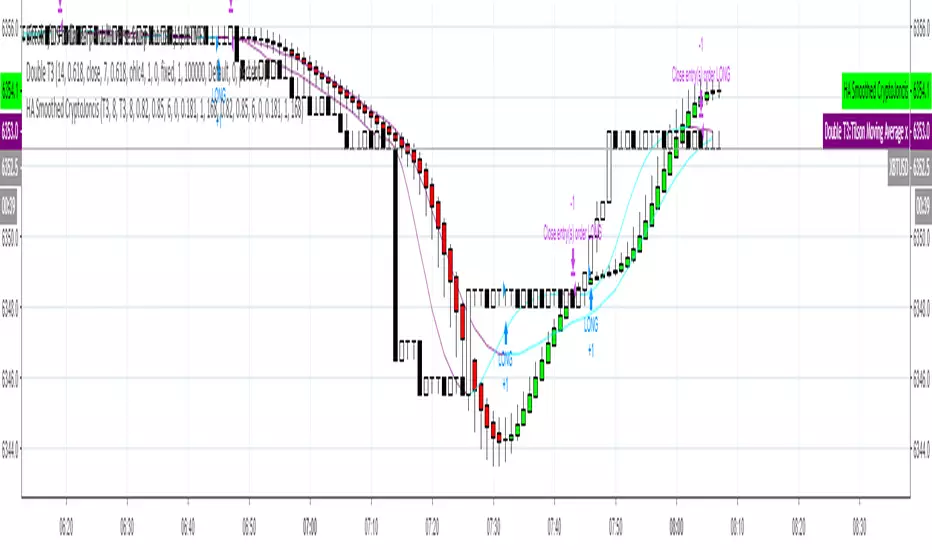
Heikin-Ashi Smoothed with option to change MA types CryptoJoncisPine Script version=3
Author CryptoJoncis
Heikin-Ashi Smoothed
The Heikin-Ashi Smoothed study is based upon the standard Heikin-Ashi study with additional moving average calculations. The following is the calculation formula for the bars:
1. The current bar Open, High, Low, Close values are smoothed individually by using the moving average type specified by the Moving Average Type 1 Input with a length/period specified by the Moving Average Period 1 Input.
2. The Heikin-Ashi bar Open, High, Low, Close values are set using the smoothed values from step 1. This is performed using the standard Heikin-Ashi formula.
3. The final Heikin-Ashi Open, High, Low, Close values are calculated by doing a second smoothing of the bar values from step 2 by using the moving average type specified by the Moving Average Type 2 Input with a length/period specified by the Moving Average Period 2 Input.
If you choose to tick the box where it offers to use only one smoothed HA then it skips the third/final step and you do not need to choose the second MA type for it to work.
Remember, using FRAMA, always make sure you use even number for length.
For simple Heikin-Ashi, please tick single smoothed and DEFAULT (Not smoothed as there are no MA used)
Heikin-Ashi bars are calculated:
1. Close = (Open + High + Low + Close) / 4
This is the average price of the current bar.
2. Open = (Open of Previous Bar + Close of Previous Bar) / 2
This is the midpoint of the previous bar.
3. High = Max of (High, Open, Close)
Highest value of the three.
4. Low = Min of (Low, Open, Close)
Lowest value of the three.
Any questions/suggestions/errors or spelling mistakes? Please leave a comment and let me know. I will try to fix it.
This took me few days to finish, so I hope you will find it useful.
Would you like to have more MA type choices? Please comment down with any other which aren't included in this indicator and I will research them and add.
MA included in this script:
Tillson Moving Average (T3)
Double Exponential Moving Average (DEMA)
Arnaud Legoux Moving Average (ALMA)
Least Squares Moving Average (LSMA)
Simple Moving Average (SMA)
Exponential Moving Average (EMA)
Weighted Moving Average (WMA)
Smoothed Moving Average (SMMA)
Triple Exponential Moving Average (TEMA)
Hull Moving Average (HMA)
Adaptive moving average (AMA)
Fractal Adaptive Moving Average (FAMA)
Variable Index Dynamic Average (VIDYA)
Triangular Moving Average (TRIMA)
You can use,publish,modify this code in any way as you wish, but only if you reference me after.
You are not allowed to sell it as it is.
If this code is useful to you, then consider to buy me a coffee (or better a pint of beer) by donating Bitcoin or Etherium to:
BTC: 3FiBnveHo3YW6DSiPEmoCFCyCnsrWS3JBR
ETH: 0xac290B4A721f5ef75b0971F1102e01E1942A4578
References:
www.sierrachart.com
www.investopedia.com
www.binarytribune.com
www.investopedia.com
www.stockfetcher.com
www.mql5.com
www.incrediblecharts.com
help.cqg.com
www.blastchart.com
Adaptive Moving AverageAdaptive Moving Average indicator script. This indicator was originally developed by Vitali Apirine (Stocks & Commodities V.36:5: Adaptive Moving Averages).
