MACD & Bollinger Bands Overbought OversoldMACD & Bollinger Bands Reversal Detector
This indicator combines the power of MACD divergence analysis with Bollinger Bands to help traders identify potential reversal points in the market.
Key Features:
MACD Calculation & Divergence:
The script calculates the standard MACD components (MACD line, Signal line, and Histogram) using configurable fast, slow, and signal lengths. It includes a simplified divergence detection mechanism that flags potential bearish divergence—when the price makes a new swing high but the MACD fails to confirm the move. This divergence can serve as an early warning that the bullish momentum is waning.
Bollinger Bands:
A 20-period simple moving average (SMA) is used as the basis, with upper and lower bands drawn at 2 standard deviations. These bands help visualize overbought and oversold conditions. For example, a close at or above the upper band suggests the market may be overextended (overbought), while a close at or below the lower band may indicate oversold conditions.
Visual Alerts:
The indicator plots the Bollinger Bands on the chart along with labels marking overbought and oversold conditions. Additionally, it marks potential bearish divergence with a downward triangle, providing a quick visual cue to traders.
Usage Suggestions:
Confluence with Other Signals:
Use the divergence signals and Bollinger Band conditions as filters. For example, even if another indicator suggests a long entry, you might avoid it if the price is overbought or if MACD divergence warns of weakening momentum.
Customization:
All key parameters, such as the MACD lengths, Bollinger Band period, and multiplier, are fully configurable. This flexibility allows you to adjust the indicator to suit different markets or trading styles.
Disclaimer:
This script is provided for educational purposes only. Always perform your own analysis and backtesting before trading with live capital.
Algotrading

Ichimoku Score Indicator [tanayroy]The Ichimoku Cloud is a comprehensive indicator that provides a clear view of market states through five key components. By analyzing the interaction between these components and the asset's price, traders can gain insights into trend direction, momentum, and potential reversals.
Introducing the Ichimoku Score System
I have developed a scoring system that quantifies these interactions, offering an objective method to evaluate market conditions. The score is calculated based on the relative positioning of Ichimoku components, with adjustable weightings via user input.
Scoring Criteria
Each component contributes to the overall score as follows:
Price vs. Cloud (Kumo) & Other Components
Price vs. Kumo → 2 Points
Price vs. Kumo Shadow → 0.5 Points
Tenkan vs. Kijun
Tenkan vs. Kijun → 2 Points
Tenkan vs. Kumo → 0.5 Points
Kijun vs. Kumo → 0.5 Points
Tenkan Slope → 0.5 Points
Kijun Slope → 0.5 Points
Chikou Span Interactions
Price vs. Chikou → 2 Points
Chikou vs. Kumo → 0.5 Points
Chikou Consolidation → 0.5 Points
Senkou Span Analysis
Senkou A vs. Senkou B → 2 Points
Senkou Slope → 0.5 Points
Price vs. Key Levels
Price vs. Tenkan → 2 Points
Price vs. Kijun → 2 Points
Interpreting the Score
The aggregate score functions as an oscillator, fluctuating between a range of ±16.0.
A higher score indicates strong bullish momentum.
A lower score suggests bearish market conditions.
To enhance readability and smooth fluctuations, a 9-period SMA is applied to the score.
Application in Algorithmic Trading
This scoring system helps integrate Ichimoku Cloud principles into algorithmic trading strategies by providing a structured and quantifiable method for assessing market conditions.
Would love to hear your feedback! 🚀 Let me know how this system works for you.

Weekly RSI Buy/Sell SignalsWeekly RSI Buy/Sell Signal Indicator
This indicator is designed to help traders identify high-probability buy and sell opportunities on the weekly chart by using the Relative Strength Index (RSI). By utilizing weekly RSI values, this indicator ensures signals align with broader market trends, providing a clearer view of potential price reversals and continuation.
How It Works:
Weekly RSI Calculation: This script calculates the RSI using a 14-period setting, focusing on the weekly timeframe regardless of the user’s current chart view. The weekly RSI is derived using request.security, allowing for consistent signals even on intraday charts.
Signal Conditions:
Buy Signal: A buy signal appears when the RSI crosses above the oversold threshold of 30, suggesting that price may be gaining momentum after a potential bottom.
Sell Signal: A sell signal triggers when the RSI crosses below the overbought threshold of 70, indicating a possible momentum shift downwards.
Visual Cues:
Buy/Sell Markers: Clear green "BUY" and red "SELL" markers are displayed on the chart when buy or sell conditions are met, making it easy to identify entry and exit points.
RSI Line and Thresholds: The weekly RSI value is plotted in real time with color-coded horizontal lines at 30 (oversold) and 70 (overbought), providing a visual reference for key levels.
This indicator is ideal for traders looking for reliable, trend-based signals on higher timeframes and can be a helpful tool for filtering out shorter-term market noise.

Z-Score Pairs TradingTitle: Z-Score Pairs Trading Indicator
Description:
This indicator implements a Z-score based pairs trading strategy, allowing traders to identify potential statistical arbitrage opportunities between two selected assets.
Key Features:
- Calculates Z-score for the price difference between any two user-selected symbols
- Visualizes Z-score with customizable thresholds for signals
- Generates long and short signals based on extreme Z-score values
- Adaptable to various markets including stocks, ETFs, and commodities
How It Works:
1. The indicator calculates the price difference between two selected symbols.
2. It then computes the Z-score of this difference, showing how far the current spread deviates from its historical average.
3. When the Z-score exceeds set thresholds (default ±2), the indicator generates trading signals.
Settings:
- Symbol A and Symbol B: Select any two tradable symbols to compare
- Lookback Period: Number of periods for calculating the moving average and standard deviation
Interpretation:
- Z-score above 2: Potential short signal (pair is likely overextended)
- Z-score below -2: Potential long signal (pair is likely oversold)
- Z-score between -2 and 2: Normal trading range, no signals
Visual Aids:
- Blue line: Z-score
- Dashed lines: Threshold levels at 0, ±1, and ±2
- Green triangles: Long signals
- Red triangles: Short signals
Disclaimer:
This indicator is for educational and research purposes only. Trading carries a high level of risk. Always conduct your own analysis and manage your risk appropriately before entering any trade.
Made by @marekfleisi

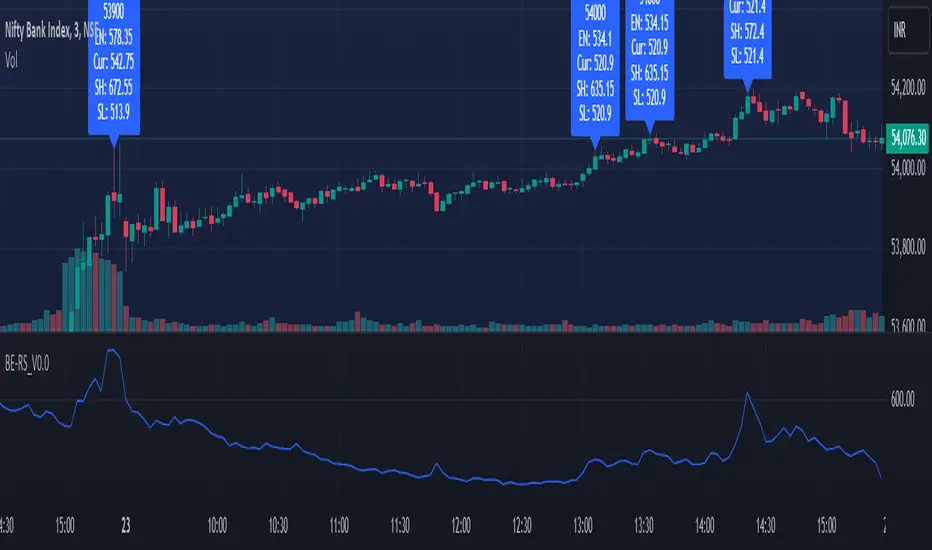
Rolling Straddle PremiumScript is Basically intended to provide insight's on the Rolling Straddle premium for the selected index based on the input settings.
Important thing to consider for the script to work seamlessly:
Specify the LTP in the input field (need not be very accurate)
Specify the Expiry Date for the Option Strike.
Ensure Profile matches to the chart script (Index Script)
Note: Zones marked in Blue, is the max level that indicator can track the option prices. beyond which it may fail to track, during such time consider reloading the indicator with Latest LTP .
Labels on the chart indicate that If i had shorted the Straddle, what would be my current position of that Straddle. however the rational behind shorting is only the pivot high points (not sure if this is right or wrong! )
Note On Labels: Labels are delayed basis the pivot point candles specified in the indicator settings.
EN: Entry Price (Straddle Premium) of the Strike Specified.
Cur: Current Price ( Current Straddle Premium ) of the Strike Specified.
SH: Max Straddle Premium ( Increase in Premium ) since position is active.
SL: Min Straddle Premium ( Premium Erosion ) since position is active.
Market Structure MTF"Market Structure MTF" is designed to help traders analyze and visualize market structures across up to three different timeframes. It allows users to customize various parameters such as period length, label size, and colors for different elements. The indicator identifies and tracks key market structure components, such as highs and lows, break of structure, and displays this information directly on the chart. It is also useful when studying Algo Trade concepts.
Additionally, it includes a table summarizing trends and providing the efficiency of the latest market data for each timeframe.
Recommended Settings
If you're new to this indicator, it's recommended to start with a single timeframe to become familiar with its functionality.
Once comfortable, you can use the following timeframes:
Base Timeframe : 15 minutes
Secondary Timeframe : 1 hour
Tertiary Timeframe : 4 hours
Another example setup could be:
Base Timeframe : 1 hour
Secondary Timeframe : 4 hours
Tertiary Timeframe : 1 day
Important Notes
Multiples of Base Timeframe : Ensure that the secondary and tertiary timeframes are multiples of the base timeframe. This ensures consistency and accuracy in analysis.
Display Order : It is recommended to display the timeframes in the correct order, with the current timeframe displayed on top of the previous ones.
Customization : You can customize the period length, label size, shapes, and colors to match your preferences.
Market Structure Elements : The indicator tracks key market structure elements such as highs and lows, which are crucial for understanding market trends and potential reversal points.
Trend Summary Table : The included table summarizes trends and provides an overview of the latest market data, helping you make informed trading decisions. The "Efficiency" column shows whether the latest structure is IPA (Inefficient Price Action) or EPA (Efficient Price Action).

Matrix Glitch | FractalystThe Matrix Glitch indicator is a visually engaging tool for traders, inspired by the iconic Matrix movie effects. It overlays price charts with dynamic, multi-colored glitches that sync with market data, creating a striking, almost surreal visual experience.
The indicator uses characters from various languages (e.g., Japanese, Chinese, Russian, English) to mimic the digital rain effect from the movies. Users can select a language, which activates a corresponding array of characters. These characters are randomly picked from the chosen array and displayed on the chart.
Underlying Calculations and Logic
Arrays in the Indicator
1- Character Management:
The script uses arrays to store sets of characters representing different symbols or alphabets. These arrays allow the indicator to dynamically select and update characters for display. Each element in these arrays corresponds to a specific character that will be used to populate the grid.
2- Current and Previous States:
Arrays are employed to keep track of the current state of characters that are displayed on the grid. Simultaneously, another set of arrays records the previous state of these characters. This dual-state management allows the script to smoothly transition between updates, handling changes in characters and visual effects like fading.
3- Transparency Control:
Transparency levels for each character in the grid are managed through arrays. These arrays store the opacity values, ensuring that each character has the appropriate level of transparency. By comparing the current and previous transparency states, the script can create effects like gradual fading or intensifying visibility.
4- Rain Effect Simulation:
To create the "rain" effect, the script maintains arrays that simulate the falling text by continuously updating the position and visibility of characters. As new characters enter the top of the grid, older ones are removed from the bottom, with their transparency levels adjusted to simulate movement.
5- Operational Flow:
Initialization : Arrays are initialized to manage both the characters and their transparency. This setup allows the script to handle the dynamic display efficiently.
Updates : During each cycle, new characters are selected and old characters are shifted accordingly. The arrays ensure that both the content and appearance of the grid are updated seamlessly.
Rendering : The arrays dictate how characters and their transparency are rendered on the grid, ensuring a cohesive and visually appealing effect.
Here's how to use the indicator step-by-step:
1- Apply the Indicator to Your Charts:
Begin by adding the indicator to your chart. This will activate the visual effect on your selected trading instrument or time frame.
Select Your Preferred Language of the Matrix Characters:
In the settings, choose the language or symbol set you want the matrix characters to display. This could be anything from traditional matrix-style characters to different alphabets or custom symbols.
2- Choose the Matrix Effect (Rain, Burst):
Decide on the type of visual effect you prefer. You can select from options like the classic "rain" effect, where characters fall from the top of the screen, or a "burst" effect, where characters explode outward or appear in a different dynamic pattern.
3- Adjust the Color According to Your Preference:
Customize the color of the matrix characters to suit your aesthetic or chart theme. You can select from a range of colors or even set up a gradient for more complex visual effects.
4- Adjust the Width and Height of the Matrix According to Your Screen:
Fine-tune the dimensions of the matrix display. Set the width and height so that the matrix fits perfectly on your screen, ensuring that it aligns well with other chart elements and doesn't obstruct your view.
------
What Makes the Matrix Glitch Indicator Unique?
Language Selection:
Customizable Language: Unlike many indicators that might offer static or limited visual elements, the Matrix Glitch Indicator allows users to choose from a variety of languages for the characters displayed. This feature not only personalizes the user experience but also adds a cultural or linguistic element to trading charts. Users can select languages like Japanese, Chinese, Russian, or English, and many more.
This flexibility ensures that traders from different backgrounds can feel a connection with their charts through familiar or exotic scripts.
Dynamic Effects:
Effect Modes: The indicator offers two distinct modes - Rain Mode and Burst Mode. In Rain Mode, characters fall from the top of the chart, mimicking the iconic digital rain from the Matrix films.
In Burst Mode, characters radiate outward from a central point, creating a unique visual effect that can be synchronized with market volatility.
This dual-mode functionality allows traders to choose how they want their data to be visually represented, providing both aesthetic variety and potentially different insights into market behavior.
Color Customization:
Full Color Control: The ability to fully customize the color of the characters is a standout feature. Traders can match the indicator's colors to their trading platform's theme, their mood, or even specific market conditions (e.g., red for downturns, green for upturns). This level of customization not only aids in creating a personalized trading environment but can also serve as a visual cue for different market states.
Universal Display Compatibility:
Adjustability for All Displays: The indicator is designed to be fully adjustable for various screen resolutions and sizes. This ensures that whether you're trading on a high-resolution monitor, a laptop, or even a mobile device, the Matrix Glitch effect remains clear and impactful without compromising on the functionality of the trading chart. This adaptability is crucial in an era where trading can happen anywhere, making the indicator a versatile tool for traders on the go or in a static setup.
------
Terms and Conditions | Disclaimer
Our charting tools are provided for informational and educational purposes only and should not be construed as financial, investment, or trading advice. They are not intended to forecast market movements or offer specific recommendations. Users should understand that past performance does not guarantee future results and should not base financial decisions solely on historical data.
Built-in components, features, and functionalities of our charting tools are the intellectual property of @Fractalyst use, reproduction, or distribution of these proprietary elements is prohibited.
By continuing to use our charting tools, the user acknowledges and accepts the Terms and Conditions outlined in this legal disclaimer and agrees to respect our intellectual property rights and comply with all applicable laws and regulations.

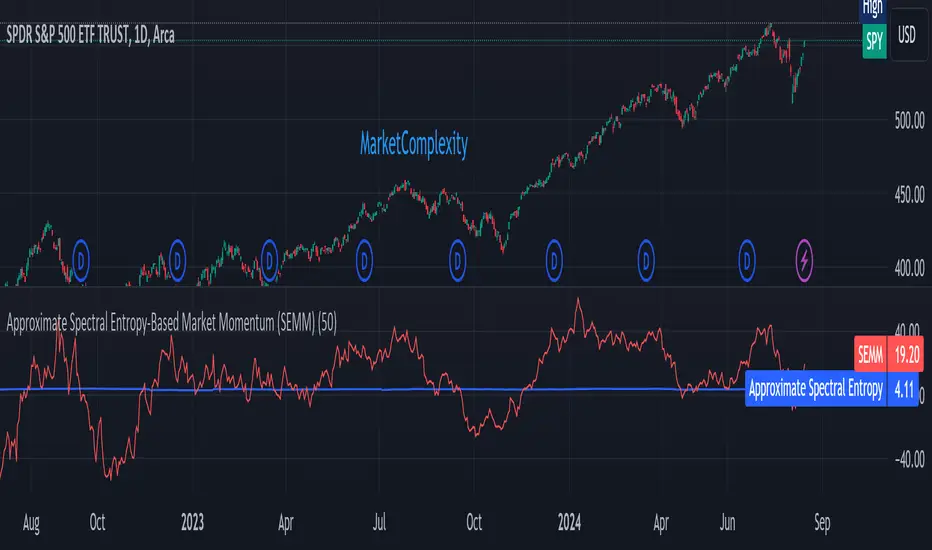
Approximate Spectral Entropy-Based Market Momentum (SEMM)Overview
The Approximate Spectral Entropy-Based Market Momentum (SEMM) indicator combines the concepts of spectral entropy and traditional momentum to provide traders with insights into both the strength and the complexity of market movements. By measuring the randomness or predictability of price changes, SEMM helps traders understand whether the market is in a trending or consolidating state and how strong that trend or consolidation might be.
Key Features
Entropy Measurement: Calculates the approximate spectral entropy of price movements to quantify market randomness.
Momentum Analysis: Integrates entropy with rate-of-change (ROC) to highlight periods of strong or weak momentum.
Dynamic Market Insight: Provides a dual perspective on market behavior—both the trend strength and the underlying complexity.
Customizable Parameters: Adjustable window length for entropy calculation, allowing for fine-tuning to suit different market conditions.
Concepts Underlying the Calculations
The indicator utilizes Shannon entropy, a concept from information theory, to approximate the spectral entropy of price returns. Spectral entropy traditionally involves a Fourier Transform to analyze the frequency components of a signal, but due to Pine Script limitations, this indicator uses a simplified approach. It calculates log returns over a rolling window, normalizes them, and then computes the Shannon entropy. This entropy value represents the level of disorder or complexity in the market, which is then multiplied by traditional momentum measures like the rate of change (ROC).
How It Works
Price Returns Calculation: The indicator first computes the log returns of price data over a specified window length.
Entropy Calculation: These log returns are normalized and used to calculate the Shannon entropy, representing market complexity.
Momentum Integration: The calculated entropy is then multiplied by the rate of change (ROC) of prices to generate the SEMM value.
Signal Generation: High SEMM values indicate strong momentum with higher randomness, while low SEMM values indicate lower momentum with more predictable trends.
How Traders Can Use It
Trend Identification: Use SEMM to identify strong trends or potential trend reversals. Low entropy values can indicate a trending market, whereas high entropy suggests choppy or consolidating conditions.
Market State Analysis: Combine SEMM with other indicators or chart patterns to confirm the market's state—whether it's trending, ranging, or transitioning between states.
Risk Management: Consider high SEMM values as a signal to be cautious, as they suggest increased market unpredictability.
Example Usage Instructions
Add the Indicator: Apply the "Approximate Spectral Entropy-Based Market Momentum (SEMM)" indicator to your chart.
Adjust Parameters: Modify the length parameter to suit your trading timeframe. Shorter lengths are more responsive, while longer lengths smooth out the signal.
Analyze the Output: Observe the blue line for entropy and the red line for SEMM. Look for divergences or confirmations with price action to guide your trades.
Combine with Other Tools: Use SEMM alongside moving averages, support/resistance levels, or other indicators to build a comprehensive trading strategy.
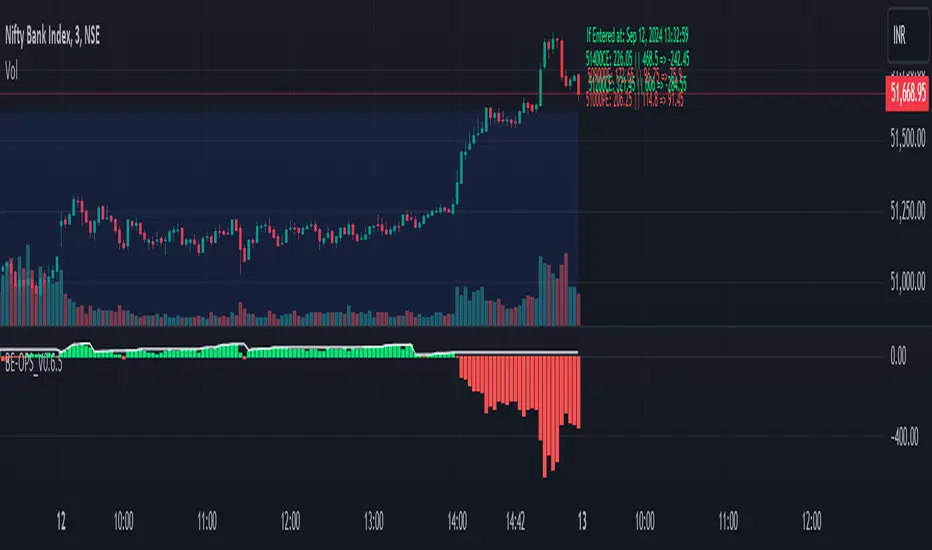
BE-NSE-Distributed Straddle Intraday Trading StrategyHerewith publishing the script (not the Indicator!) for the benift of Option Traders. I call this a script as this doesn't perform any kind of analysis of candle data and provide general BUY | SELL information. This Script is based on the TRUE VALUES concept which is nothing but LTP.
Idea Behind this Script:
As an option seller i need the lower risk option premium to trade. so that, time can work in our favor. basic question which we get at the first is which option to choose out of many available.
If traders feel the question is apt then this script is for them.
Logic Behind this script:
Upon Market Open, script in the BACKEND ( Under the hood ) deployes 60 possible combinations of STRADDLES for sampling, and continue to monitor the LTP movements and compares it against opposite pairs. lets say out of 30 Straddle options one of the Straddle it picked is ATM CE VS ATM PE. for 1 rs move in underlying how much impact is happening in CE VS PE.
This simple anlysis is done at every 30 seconds. once the Analysis is complete it picks 4 options 2 on the CALL side and 2 on the PUT side, which script feels the movement of prices are smooth. SMOOTH refers that time decay that can work in our favor..
Calculations behid the script:
lets say BNF LTP is 52000 at 9:20 AM, and one of the pair script took for sampling was ATM CE vs PE which are having the LTP of 100 each.
At 9:35 AM, BNF is trading at 52075, and ATM CE is reading the LTP of 122 and ATM PUT is reading the LTP of 70. ideally LTP of Call should be around 135 and Put should be around 65 considering the usual delta of 0.48 . Net Money Index for this Pair Sample is 8
Call Side => 100 - 122 = -22
Put Side => 100 - 70 = 30
Money Index => 30 - 22 = 8 for 15 Min
This Money index is calculated across choosen samples and the Option strikes is provided as an output which has mere possiblity of working in Options Seller's favor.
How to Read the Output:
For the choosen strikes from the time of Entry (Suggested Entry time by script) till the current time, the bottom pane plots the Money index as columns. Green Columns indicate that how much option premium eroded due to time decay. Red Columns indicate that how much Option premium increased during the time.
Note: Script dynamically calculate the strikes and suggests in realtime.
WARNING or a Humble Request:
For those who don't understand the word "Repaint" how it works in Pine Script. plz don't consider using this script. For those who wish to understand I have kept the Observer mode in the settings which shall guide you on why the Money Index shown on the chart when the MARKET IS CLOSED is different than when the MARKET IS OPEN (Realtime).
Disclaimer:
I have tested the script only in BNF and not sure if this works on Nifty, FinNifty or others. you may still try and plz do provide the feedback for improvising the script.
----- BreathEasy --------
The information contained in my scripts/indicators/ideas does not constitute financial advice or a solicitation to buy or sell any securities of any type. I will not accept liability for any loss or damage, including without limitation any loss of profit, which may arise directly or indirectly from the use of or reliance on such information.
All investments involve risk, and the past performance of a security, industry, sector, market, financial product, trading strategy, or individual’s trading does not guarantee future results or returns. Investors are fully responsible for any investment decisions they make. Such decisions should be based solely on an evaluation of their financial circumstances, investment objectives, risk tolerance, and liquidity needs.
My scripts/indicators/ideas are only for educational purposes!
Multi-Spectral RSI Deviations [AlgoAlpha]🌌 Multi-Spectral RSI Deviations by AlgoAlpha - Dive into Market Dynamics! 🌠
Dive deep into the essence of market trends with our 🚀 Multi-Spectral RSI Deviations indicator, a comprehensive tool designed by AlgoAlpha to enhance your trading strategy. By harnessing the power of multiple RSI lengths and innovative smoothing techniques, this indicator offers a unique perspective on market momentum and potential reversals.
🔍 Key Features:
🎨 Customizable up and down colors for immediate trend recognition.
🔢 Three RSI lengths for multi-layered market analysis.
🔄 Various Moving Average (MA) types including SMA, EMA, and more for tailored smoothing.
✅ Bullish and Bearish divergence plotting for spotting potential reversals.
🕵️♂️ Adjustable divergence sensitivity settings to fine-tune signal detection.
🔔 Built-in alerts for trend shifts and reversal conditions, ensuring you never miss a trading opportunity.
🚀 Quick Guide to Using the Multi-Spectral RSI Deviations Indicator
🛠 Add the Indicator: Search for "Multi-Spectral RSI Deviations" in TradingView's Indicators & Strategies. Adjust the RSI lengths and MA settings to suit your trading strategy.
🔍 Market Analysis: Keep an eye on the color changes for trend direction and use divergence plots to anticipate potential market reversals.
🔔 Alerts Setup: Activate the built-in alerts for trend shifts and reversals to stay ahead of the game without having to constantly monitor the charts.
🧠 How It Works:
At the core of the Multi-Spectral RSI Deviations indicator is its ability to analyze the market through various RSI lengths, providing a comprehensive view of momentum. The indicator calculates the Relative Strength Index (RSI) over three different periods, creating a spectrum of momentum insights. These RSI values are then compared to each other to identify the momentum shifts within the market.
To refine these insights, the differences between these RSI values are smoothed using a selected Moving Average type, such as SMA, EMA, etc., based on user preference. This smoothing process helps in highlighting the overall trend direction and potential reversal points with greater clarity.
Furthermore, the indicator employs a color-coding system, where the plotted line changes color based on the momentum's direction—shifting to an up color for positive momentum and a down color for negative momentum. This visual cue enables traders to quickly discern the market trend at a glance.
Divergences between the price action and the indicator's values are another cornerstone of this tool. By plotting potential bullish and bearish divergences, the indicator provides early signals of possible trend reversals, offering traders a strategic advantage.
Embrace the power of our 🌌 Multi-Spectral RSI Deviations and elevate your trading to stellar heights! 🌠✨

Arbitrage Spread v2 : 3 pairs + 3 charts [Arby.Trade]
This indicator allows you to track in real time the change in the spread (the difference in the exchange rate) between two assets for three trading pairs at the same time.
How does the indicator work?
In the indicator settings menu, the user selects two trading pairs, for example BTCUSDT on the Binance exchange and BTCUSDT on the Bybit exchange, after which the script will receive prices from both exchanges and compare them with each other, calculating the percentage deviation between prices (spread). This setting can be made for three trading pairs. Keep in mind that the script can only work with those assets and exchanges that are on board TradingView, and this is quite a lot.
According to the calculated value of spreads, the spread lines for three trading pairs are displayed on the screen. The spread lines move between values above zero and below. When the spread line is below zero, it means that the price of the asset on the first exchange is less than on the second. That is, by buying an asset on the first exchange and selling it on the second one, you can earn money (of course, it is important to take into account the commissions of the exchanges for these transactions). When the spread line is above zero, the opposite is true. When the spread is zero, the prices on both exchanges are the same and there is no arbitrage situation.
Indicator settings.
For a better visual representation of the current spread value, the indicator has the ability to set two threshold spread levels. The first threshold level is the level below which the spread is not interesting to the trader and he will not consider arbitrage deals. The second threshold level is the level of a particularly high spread. When the spread value exceeds the second threshold level, the spread values will be signed above the spread line, and the extreme values for the user-defined period of bars back will be additionally highlighted in a brighter color. Both threshold levels are displayed on the chart and the user can change their values in the indicator settings menu.
The script allows you to leave only one spread line on the chart for one of the three trading pairs, while maintaining the display of indicator tables for three trading pairs. The script also allows you to completely disable the display of unnecessary trading pairs.
If the volatility of the spread lines is too high and the spread lines from different trading pairs overlap each other, use the "Distance between charts" setting and increase its value until the display of all three charts becomes comfortable.
Alerts.
Additionally, you can set the threshold value of the spread, at which the script will send notifications from TradingView. We called it the Spread Signal Threshold. This threshold level has nothing to do with the visual thresholds described above. You can set a signal level exceeding the second visual threshold or make it lower, but it is important to understand that TradingView alerts will only be triggered if the Spread Signal Threshold is exceeded. This threshold level is common to all trading pairs, so notifications will be sent when this spread level is reached for any of the three trading pairs.
To set up alerts, open the "Alerts" tab in the TradingView menu on the right. Click the "Create Alert" button. Then, in the window that opens, select this indicator in the "Condition" line. After that, you can set a name for this alert and complete the notification setup by clicking the "Create" button.
We, the authors of this script, have been engaged in cryptocurrency arbitrage for a long time and, first of all, created it for ourselves and our daily arbitrage trading, but this does not prevent you from using it at your discretion for any types of assets and in any markets.
We have a lighter version of the indicator that allows you to track the spread for only one trading pair. If this indicator seems too heavy for you and your device, you can use a lighter version .
If, on the contrary, the capabilities of your hardware allow, do not forget that you can always add several copies of this indicator to your screen and simultaneously track not 3, but 6-9-12 and so on arbitrage pairs at the same time. ;)
--
Данный индикатор позволяет отслеживать в реальном времени изменение спреда (разницы в курсе) между двумя активами по трем торговым парам.
Как устроен индикатор?
В меню настроек индикатора пользователь выбирает две торговые пары, например BTCUSDT на бирже Binance и BTCUSDT на бирже Bybit, после чего скрипт получит цены с обеих бирж и сравнит их между собой, рассчитав процентное отклонение между ценами (спред). Такую настройку можно произвести для трех торговых пар. Учитывайте, что скрипт может работать только с теми активами и биржами, которые есть на борту TradingView, и это не мало.
По рассчитанному значению спредов на экран выводится линии спредов по трем торговым парам. Линии спредов двигаются между значениями то выше нуля, то ниже. Когда линия спреда ниже нуля это значит что цена на актив на первой бирже меньше, чем на второй. То есть, купив актив на первой бирже и продав его на второй можно заработать (конечно при этом важно учитывать комиссии бирж на совершение данных сделок). Когда линия спреда выше нуля - наоборот. Когда спред равен нулю - цены на обеих биржах одинаковы и арбитражная ситуация отсутствует.
Настройки индикатора.
Для лучшего визуального представления о текущем значении спреда индикатор имеет возможность задать два пороговых уровня спреда. Первый пороговый уровень – это уровень, ниже которого спред не интересен трейдеру и он не будет рассматривать арбитражные сделки. Второй пороговый уровень – это уровень особенно повышенного спреда. Когда значение спреда превышает второй пороговый уровень над линией спреда будут подписаны значения спреда, а экстремальные значения за заданный пользователем период баров назад будут дополнительно выделены более ярким цветом. Оба пороговых уровня отображаются на графике и пользователь может менять их значения в меню настроек индикатора.
Скрипт позволяет оставить на графике только одну линию спреда по одной из трех торговых пар, при этом сохранив отображение индикаторных таблиц по трем торговым парам. Также скрипт позволяет полностью отключить отображение ненужных торговых пар.
Если волатильность линий спреда слишком высока и линии спреда от разных торговых пар накладываются друг на друга воспользуйтесь настройкой «Distance between charts» и увеличивайте ее значение до тех пор пока отображение всех трех графиков не станет комфортным.
Уведомления.
Дополнительно можно настроить пороговое значение спреда, при достижении которого скрипт будет отправлять уведомления от TradingView. Мы назвали это Spread Signal Threshold. Этот пороговый уровень никак не связан с визуальными пороговыми уровнями, описанными выше. Вы можете задать сигнальный уровень превышающий второй визуальный пороговый уровень или сделать его ниже, но важно понимать, что оповещения TradingView будут срабатывать только от превышения именно Spread Signal Threshold. Этот пороговый уровень является общим для всех торговых пар, поэтому уведомления будут приходить при достижении этого уровня спреда по любой из трех торговых пар.
Для настройки оповещений откройте вкладку «Оповещения» в меню TradingView справа. Нажмите кнопку «Создать оповещение». Затем в открывшемся окне в строке «Условие» выберете данный индикатор. После чего вы можете задать название данному оповещению и завершить настройку оповещения, нажав кнопку «Создать».
Мы, авторы данного скрипта, давно занимаемся арбитражем криптовалюты и, в первую очередь, создавали его для себя и своей каждодневной арбитражной торговли, но это не мешает вам использовать его по своему усмотрению для любых видов активов и на любых рынках.
У нас есть более легкая версия индикатора, позволяющая отслеживать спред только по одной торговой паре. Если данный индикатор покажется для вас и вашего устройства слишком тяжелым вы можете воспользоваться более легкой версией .
Если, наоборот, возможности вашего железа позволяют, не забывайте, что вы всегда можете добавить себе на экран несколько копий этого индикатора и отслеживать одновременно не 3, а 6-9-12 и тд арбитражных пар одновременно. ;)

Enhanced Candle Sticks [AlgoAlpha]🚀🌟 Introducing the Enhanced Candle Sticks by AlgoAlpha, a Pine Script tool designed to provide traders with an enhanced view of market dynamics through candlestick analysis. This script aims to visualise if price has hit the high or low of the candle first, aiding in back-testing, and to identify smaller trends using market structure.📊🔍
Key Features:
Timeframe Flexibility: Users can select their desired timeframe for analysis, offering a range of options from M15 to H12. This flexibility allows for detailed and specific timeframe analysis.
Micro Trend Identification: The script includes an option to enable 'MicroTrends', giving traders insights into smaller movements and trends within the larger market context.
Customizable Visuals: Traders can customize the colors of bullish and bearish candlesticks, enhancing visual clarity and personalizing the chart to their preferences.
State Tracking: The script tracks the 'state' of the market on lower timeframes to detect if the high or the low was formed first.
Warning System: When the selected timeframe does not match the chart timeframe, the script generates a warning, ensuring accurate analysis and preventing potential misinterpretations.
Usages:
Enhanced Back-testing: Users can now get a more accurate interpretation of the candlesticks by know if the high or the low came first (denoted with ⩚ or ⩛), especially in scenarios where the high and the low of the larger timeframe candle is touching both the take-profit and stop-loss levels.
Squeeze Analysis: Users can identify squeezes in price when the microtrend shows both an uptrend and a downtrend, possibly giving more insight into the market.
Lower Timeframe Market Structure Analysis: Microtrends form when the low of the candle is consecutively increasing and the high is consecutively falling, which means on a lower timeframe, price is forming higher lows or lower highs.
Basic Logic Explanation:
- The script starts by setting up the necessary parameters and importing the required library. Users can customize the timeframe, colors, and whether to enable micro trends and candlestick plotting.
- It then calculates the lower timeframe (1/12th of the current timeframe) for more detailed analysis. The `minutes` function helps in converting the selected timeframe into minutes.
- The script tracks new bars and calculates the highest and lowest values within an hour, using `ta.highestSince` and `ta.lowestSince`.
- It determines the market 'state' by checking if the current high is breaking the previous high and if the current low is breaking the previous low on lower timeframes to determine if the high or the low was formed first.
- The script uses the `plotchar` and `plotcandle` functions to visually represent these trends and states on the chart. This visual representation is key for quick and effective analysis.
Alerts:
Alerts can be set for microtrend formations:
This script is a valuable tool for traders looking to deepen their market analysis with enhanced candlestick visualization and micro trend tracking. 📈🔶💡

Standardized Median Proximity [AlgoAlpha]Introducing the Standardized Median Proximity by AlgoAlpha 🚀📊 – a dynamic tool designed to enhance your trading strategy by analyzing price fluctuations relative to the median value. This indicator is built to provide clear visual cues on the price deviation from its median, allowing for a nuanced understanding of market trends and potential reversals.
🔍 Key Features:
1. 📈 Median Tracking: At the core of this indicator is the calculation of the median price over a specified lookback period. By evaluating the current price against this median, the indicator provides a sense of whether the price is trending above or below its recent median value.
medianValue = ta.median(priceSource, lookbackLength)
2. 🌡️ Normalization of Price Deviation: The deviation of the price from the median is normalized using standard deviation, ensuring that the indicator's readings are consistent and comparable across different time frames and instruments.
standardDeviation = ta.stdev(priceDeviation, 45)
normalizedValue = priceDeviation / (standardDeviation + standardDeviation)
3. 📌 Boundary Calculations: The indicator sets upper and lower boundaries based on the normalized values, helping to identify overbought and oversold conditions.
upperBoundary = ta.ema(positiveValues, lookbackLength) + ta.stdev(positiveValues, lookbackLength) * stdDevMultiplier
lowerBoundary = ta.ema(negativeValues, lookbackLength) - ta.stdev(negativeValues, lookbackLength) * stdDevMultiplier
4. 🎨 Visual Appeal and Clarity: With carefully chosen colors, the plots provide an intuitive and clear representation of market states. Rising trends are indicated in a shade of green, while falling trends are shown in red.
5. 🚨 Alert Conditions: Stay ahead of market movements with customizable alerts for trend shifts and impulse signals, enabling timely decisions.
alertcondition(ta.crossover(normalizedValue, 0), "Bullish Trend Shift", "Median Proximity Crossover Zero Line")
🔧 How to Use:
- 🎯 Set your preferred lookback lengths and standard deviation multipliers to tailor the indicator to your trading style.
- 💹 Utilize the boundary plots to understand potential overbought or oversold conditions.
- 📈 Analyze the color-coded column plots for quick insights into the market's direction relative to the median.
- ⏰ Set alerts to notify you of significant trend changes or conditions that match your trading criteria.
Basic Logic Explained:
- The indicator first calculates the median of the selected price source over your chosen lookback period. This median serves as a baseline for measuring price deviation.
- It then standardizes this deviation by dividing it by the standard deviation of the price deviation over a 45-period lookback, creating a normalized value.
- Upper and lower boundaries are computed using the exponential moving average (EMA) and standard deviation of these normalized values, adjusted by your selected multiplier.
- Finally, color-coded plots provide a visual representation of these calculations, offering at-a-glance insights into market conditions.
Remember, while this tool offers valuable insights, it's crucial to use it as part of a comprehensive trading strategy, complemented by other analysis and indicators. Happy trading!
🚀

Median Proximity Percentile [AlgoAlpha]📊🚀 Introducing the "Median Proximity Percentile" by AlgoAlpha, a dynamic and sophisticated trading indicator designed to enhance your market analysis! This tool efficiently tracks median price proximity over a specified lookback period and finds it's percentile between 2 dynamic standard deviation bands, offering valuable insights for traders looking to make informed decisions.
🌟 Key Features:
Color-Coded Visuals: Easily interpret market trends with color-coded plots indicating bullish or bearish signals.
Flexibility: Customize the indicator with your preferred price source and lookback lengths to suit your trading strategy.
Advanced Alert System: Stay ahead with customizable alerts for key trend shifts and market conditions.
🔍 Deep Dive into the Code:
Choose your preferred price data source and define lookback lengths for median and EMA calculations. priceSource = input.source(close, "Source") and lookbackLength = input.int(21, minval = 1, title = "Lookback Length")
Calculate median value, price deviation, and normalized value to analyze market position relative to the median. medianValue = ta.median(priceSource, lookbackLength)
Determine upper and lower boundaries based on standard deviation and EMA. upperBoundary = ta.ema(positiveValues, lookbackLength) + ta.stdev(positiveValues, lookbackLength) * stdDevMultiplier
lowerBoundary = ta.ema(negativeValues, lookbackLength) - ta.stdev(negativeValues, lookbackLength) * stdDevMultiplier
Compute the percentile value to track market position within these boundaries. percentileValue = 100 * (normalizedValue - lowerBoundary)/(upperBoundary - lowerBoundary) - 50
Enhance your analysis with Hull Moving Average (HMA) for smoother trend identification. emaValue = ta.hma(percentileValue, emaLookbackLength)
Visualize trends with color-coded plots and characters for easy interpretation. plotColor = percentileValue > 0 ? colorUp : percentileValue < 0 ? colorDown : na
Set up advanced alerts to stay informed about significant market movements. // Alerts
alertcondition(ta.crossover(emaValue, 0), "Bullish Trend Shift", "Median Proximity Percentile Crossover Zero Line")
alertcondition(ta.crossunder(emaValue, 0), "Bearish Trend Shift", "Median Proximity Percentile Crossunder Zero Line")
alertcondition(ta.crossunder(emaValue,emaValue ) and emaValue > 90, "Bearish Reversal", "Median Proximity Percentile Bearish Reversal")
alertcondition(ta.crossunder(emaValue ,emaValue) and emaValue < -90, "Bullish Reversal", "Median Proximity Percentile Bullish Reversal")
🚨 Remember, the "Median Proximity Percentile " is a tool to aid your analysis. It’s essential to combine it with other analysis techniques and market understanding for best results. Happy trading! 📈📉

Momentum Bias Index [AlgoAlpha]Description:
The Momentum Bias Index by AlgoAlpha is designed to provide traders with a powerful tool for assessing market momentum bias. The indicator calculates the positive and negative bias of momentum to gauge which one is greater to determine the trend.
Key Features:
Comprehensive Momentum Analysis: The script aims to detect momentum-trend bias, typically when in an uptrend, the momentum oscillator will oscillate around the zero line but will have stronger positive values than negative values, similarly for a downtrend the momentum will have stronger negative values. This script aims to quantify this phenomenon.
Overlay Mode: Traders can choose to overlay the indicator on the price chart for a clear visual representation of market momentum.
Take-profit Signals: The indicator includes signals to lock in profits, they appear as labels in overlay mode and as crosses when overlay mode is off.
Impulse Boundary: The script includes an impulse boundary, the impulse boundary is a threshold to visualize significant spikes in momentum.
Standard Deviation Multiplier: Users can adjust the standard deviation multiplier to increase the noise tolerance of the impulse boundary.
Bias Length Control: Traders can customize the length for evaluating bias, enabling them to fine-tune the indicator according to their trading preferences. A higher length will give a longer-term bias in trend.

Squeeze & Release [AlgoAlpha]Introduction:
💡The Squeeze & Release by AlgoAlpha is an innovative tool designed to capture price volatility dynamics using a combination of EMA-based calculations and ATR principles. This script aims to provide traders with clear visual cues to spot potential market squeezes and release scenarios. Hence it is important to note that this indicator shows information on volatility, not direction.
Core Logic and Components:
🔶EMA Calculations: The script utilizes the Exponential Moving Average (EMA) in multiple ways to smooth out the data and provide indicator direction. There are specific lengths for the EMAs that users can modify as per their preference.
🔶ATR Dynamics: Average True Range (ATR) is a core component of the script. The differential between the smoothed ATR and its EMA is used to plot the main line. This differential, when represented as a percentage of the high-low range, provides insights into volatility.
🔶Squeeze and Release Detection: The script identifies and highlights squeeze and release scenarios based on the crossover and cross-under events between our main line and its smoothed version. Squeezes are potential setups where the market may be consolidating, and releases indicate a potential breakout or breakdown.
🔶Hyper Squeeze Detection: A unique feature that detects instances when the main line is rising consistently over a user-defined period. Hyper squeeze marks areas of extremely low volatility.
Visual Components:
The main line (ATR-based) changes color depending on its position relative to its EMA.
A middle line plotted at zero level which provides a quick visual cue about the main line's position. If the main line is above the zero level, it indicates that the price is squeezing on a longer time horizon, even if the indicator indicates a shorter-term release.
"𝓢" and "𝓡" characters are plotted to represent 'Squeeze' and 'Release' scenarios respectively.
Standard Deviation Bands are plotted to help users gauge the extremity and significance of the signal from the indicator, if the indicator is closer to either the upper or lower deviation bands, this means that statistically, the current value is considered to be more extreme and as it is further away from the mean where the indicator is oscillating at for the majority of the time. Thus indicating that the price has experienced an unusual amount or squeeze or release depending on the value of the indicator.
Usage Guidelines:
☝️Traders can use the script to:
Identify potential consolidation (squeeze) zones.
Gauge potential breakout or breakdown scenarios (release).
Fine-tune their entries and exits based on volatility.
Adjust the various lengths provided in the input for better customization based on individual trading styles and the asset being traded.

Alpha Schaff [AlgoAlpha]Description:
The Alpha Schaff indicator is a proprietary technical analysis tool that incorporates a modified version of the Schaff Trend Cycle (STC) to generate trading signals. The indicator is designed to identify potential overbought and oversold conditions in the market. It utilizes a combination of exponential moving averages (EMAs) and price volatility to generate trading signals. The plot of the indicator is derived from the opening price adjusted by a factor that depends on the Alpha Schaff value. A color scheme is used to indicate whether the current value is higher or lower than the previous value.
What is Alpha Schaff?:
Alpha Schaff is a technical indicator used in trading to identify potential trend reversals and confirm the strength of a current trend. It combines multiple moving averages and oscillators to generate buy and sell signals. Traders use Alpha Schaff to make informed decisions about entering or exiting positions based on its indications of trend momentum and market conditions.
Calculation:
The Alpha Schaff indicator calculates the difference between fast and slow EMAs based on the specified input lengths. It then measures the highest and lowest values of the difference over a defined sensitivity period. The indicator normalizes these values to a percentage scale to provide insights into the current market conditions.
How to use it?:
Monitor the color of the indicator line. A change in color indicates a potential trend reversal. For example, a switch from white to a purple color suggests a possible bullish trend, while a switch from a purple color to white indicates a potential bearish trend. Points of reversal can also be indicated by distinctive arrows pointing upwards or downward as well as visualized in bullish/bearish colors. The Distance between the indicator plot and the source can be interpreted as a measurement of price volatility. The script includes alert conditions that trigger when specific criteria are met. These alerts can notify users of potential buying or selling opportunities based on the indicator's signals.
Utility:
The Alpha Schaff is a trend-following indicator suitable for traders operating in trending markets. It offers clear and precise signals that provide valuable insights into bullish or bearish price movements. Additionally, this indicator stands out by incorporating distinctive arrows, indicating potential retracement points and allowing traders to anticipate mean reversion.
Originality:
The Alpha Schaff indicator, developed by AlgoAlpha introduces a proprietary modification to the Schaff Trend Cycle (STC) by incorporating multiple moving averages and oscillators. While the concept of the Schaff Trend Cycle exists, the specific implementation and combination of elements in the Alpha vSchaff indicator are unique to this tool. The inclusion of color schemes, arrow indicators, and volatility measurements sets it apart from other technical analysis indicators. Traders can benefit from its originality by utilizing its distinctive features to make more informed trading decisions in trending markets.

Bollinger Bands Percentile + Stdev Channels (BBPct) [AlgoAlpha]Description:
The "Bollinger Bands Percentile (BBPct) + STD Channels" mean reversion indicator, developed by AlgoApha, is a technical analysis tool designed to analyze price positions using Bollinger Bands and Standard Deviation Channels (STDC). The combination of these two indicators reinforces a stronger reversal signal. BBPct calculates the percentile rank of the price's standard deviation relative to a specified lookback period. Standard deviation channels operate by utilizing a moving average as the central line, with upper and lower lines equidistant from the average based on the market's volatility, helping to identify potential price boundaries and deviations.
How it Works:
The BBPct indicator utilizes Bollinger Bands, which consist of a moving average (basis) and upper and lower bands based on a specified standard deviation multiplier. By default, it uses a 20-period moving average and a standard deviation multiplier of 2. The upper band is calculated by adding the basis to the standard deviation multiplied by the multiplier, while the lower band is calculated by subtracting the same value. The BBPct indicator calculates the position of the current price between the lower and upper Bollinger Bands as a percentile value. It determines this position by comparing the price's distance from the lower band to the overall range between the upper and lower bands. A value of 0 indicates that the price is at the lower band, while a value of 100 indicates that the price is at the upper band. The indicator also includes an optional Bollinger Band standard deviation percentage (%Stdev) histogram, representing the deviation of the current price from the moving average as a percentage of the price itself.
Standard deviation channels, also known as volatility channels, aid in identifying potential buying and selling opportunities while minimizing unfavorable trades. These channels are constructed by two lines that run parallel to a moving average. The separation between these lines is determined by the market's volatility, represented by standard deviation. By designating upper and lower channel lines, the channels demarcate the borders between typical and atypical price movements. Consequently, when the market's price falls below the lower channel line, it suggests undervaluation, whereas prices surpassing the upper channel line indicate overvaluation.
Signals
The chart displays potential reversal points through the use of red and green arrows. A red arrow indicates a potential bearish retracement, signaling a possible downward movement, while a green arrow represents a potential pullback to the positive, suggesting a potential upward movement. These signals are generated only when both the BBPct (Bollinger Bands Percentage) and the STDC (Standard Deviation Channel) indicators align with bullish or bearish conditions. Consequently, traders might consider opening long positions when the green arrow appears and short positions when the red arrow is plotted.
Usage:
This indicator can be utilized by traders and investors to effectively identify pullbacks, reversals, and mean regression, thereby enhancing their trading opportunities. Notably, extreme values of the BBPct, such as below -5 or above 105, indicate oversold or overbought conditions, respectively. Moreover, the presence of extreme STDC zones occurs when prices fall below the lower channel line or cross above the upper channel line. Traders can leverage this information as a mean reversion tool by identifying instances of peak overbought and oversold values. These distinctive characteristics facilitate the identification of potential entry and exit points, thus augmenting trading decisions and enhancing market analysis.
The indicator's parameters, such as the length of the moving average, the data source, and the standard deviation multiplier, can be customized to align with individual trading strategies and preferences.
Originality:
The BBPct + STDC indicator, developed by AlgoAlpha, is an original implementation that combines the calculation of Bollinger Bands, percentile ranking, the %Stdev histogram and the STDC. While it shares some similarities with the Bollinger Bands %B indicator, the BBPct indicator introduces additional elements and customization options tailored to AlgoAlpha's methodology. The script is released under the Mozilla Public License 2.0, granting users the freedom to utilize and modify it while adhering to the license terms.

Directional Bias [AlgoAlpha]The Directional Bias indicator is a premium script expertly crafted to enhance market trend visualization on trading charts. This sophisticated tool is designed to intuitively indicate the market's directional bias, aiding traders in making informed decisions on lower time frames.
Highlighted Features:
Intuitive Trend Visualization: The script employs a color-coded system for candles, simplifying the process of trend identification
Customizable Aesthetics: Users have the option to personalize the visual elements, including candle colors, to suit their preferences and enhance chart readability.
Advanced Logic: The script is built on a proprietary algorithm that analyzes candlestick patterns to determine the current trend direction.
Key Benefits:
Enhanced Decision Making: By offering a clear depiction of the market's directional bias, the indicator assists traders in making more informed entry and exit decisions, particularly suited for quick decision-making on lower timeframes.
Adaptability to Market Conditions: The script dynamically adjusts to changing market conditions, providing relevant and timely indications of trend changes or continuations.
Versatile Application: Suitable for various trading styles, the indicator can be effectively used in day trading, scalping, or even in longer-term trading strategies, depending on the timeframe selected.
Summary:
The "Directional Bias" indicator stands out as a vital tool for traders focusing on lower timeframes, offering an intuitive, customizable, and dynamic approach to trend visualization. Its advanced proprietary logic and user-friendly interface make it a valuable asset in a trader's toolkit, enhancing the ability to quickly interpret and react to market movements.

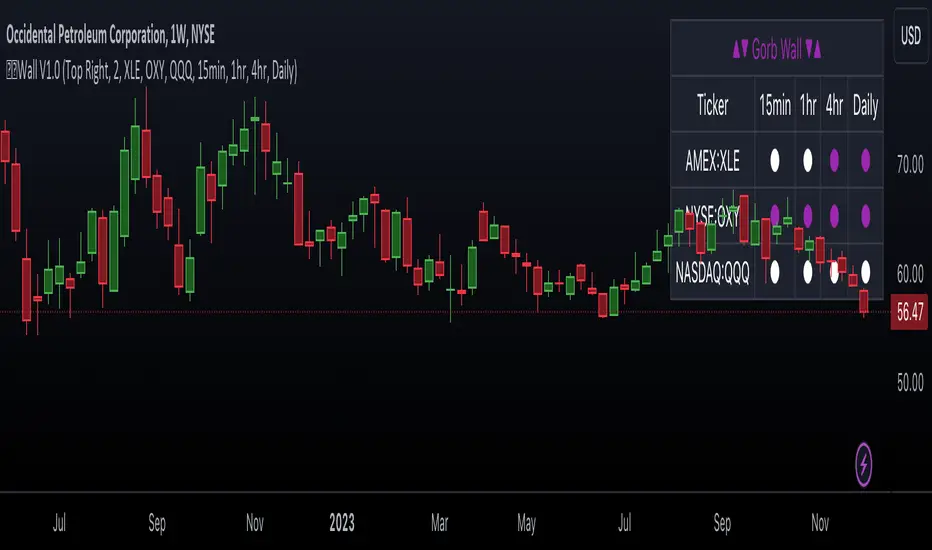
Gorb WallIntroduction:
Gorb Wall is a trading tool that offers a unique approach to market trend analysis. It extends the capabilities of the Gorb Algo indicator by presenting a multi-ticker, multi-timeframe dashboard, enabling traders to capture crucial market movements across various financial instruments without flipping through charts.
Overview:
Multi-Ticker Analysis: Monitor and analyze multiple financial instruments simultaneously.
Customizable Timeframes: Tailor the script to various timeframes to suit your trading strategy.
Gorb Algo Market Trend: An algorithm that adapts to market conditions, providing insights into trend changes.
User-Friendly Dashboard: Easily configure and customize the dashboard placement on your chart.
Color-Coded Trend Indicators: Visual cues to quickly assess bullish or bearish trends.
Optimized for Performance: Efficiently coded to ensure smooth running on TradingView without overloading resources.
How Gorb Wall Works:
The script utilizes Gorb Algo's market trend algorithm to process price and volume data across selected tickers and timeframes.
It applies a complex calculation to identify trends, using a combination of volatility analysis, momentum measurements, and trend strength indicators.
The output is a simplified visual representation on the dashboard, where colored circles indicate the trend direction, providing an at-a-glance market overview.
Unique Features:
Proprietary Algorithm: The heart of Gorb Wall lies in its unique Gorb Algo Market Trend algorithm. Unlike standard trend-following indicators, this proprietary algorithm integrates multiple technical analysis concepts (e.g., moving averages, volume data, price action, and oscillators) to provide a more comprehensive market trend analysis.
Multi-Dimensional Analysis: The script analyzes market trends by simultaneously processing data across multiple tickers and timeframes, offering a broader view of market movements than traditional single-ticker indicators.
We recommend exploring & choosing which tickers/timeframes best suits your needs and style of trading, and use that to combine with our suite of indicators.
Settings:
All skill-level friendly presets, easy to enable features with one-click
Dashboard Placement: Choose from top/bottom left/right for dashboard positioning.
Trend Speed Mode: Select the algorithm speed - Fast, Medium, Slow, Slowest.
Bullish/Bearish Trend Colors: Customize colors for trend indicators.
Additional Tickers: Input options for monitoring multiple financial instruments.
Timeframe Selection: Choose from a range of timeframes for each ticker.
How to Use
In the image below, we can see a basic example of how this indicator functions.
The dashboard displays up to three different tickers per the user's choice, with 4 different timeframes the user can choose. It that runs the algorithm line on the specified ticker & timeframe and plots a colored circle that identifies that tickers trend on the specified timeframes.
There are two colors, white for bullish trend and purple for bearish trend. These are the two consistent colors across our suit of indicators to help simplify trading by using simple color matching for confluence. Below is a continued breakdown on using this indicator:
Dynamic Trend Visualization in Real-Time Updates
The dashboard dynamically updates trend colors (white for bullish, purple for bearish) based on real-time market data, offering immediate insights into market sentiment. The next three images below these the live change in data as price action begins developing over multiple timeframes.
In the image above, we are on the 5min AAPL chart, we have SPY, QQQ, and VIX as our tickers on the dashboard with 1min, 2min, 3min, and 10min timeframes chosen. We begin to see VIX flip bullish, which can usually mean down side for indices.
We then see as AAPL's price begins to slow and reverse, we see SPY's trend following on the smaller timeframes first with VIX still leading the way indicating possible bearish change.
In the image above, we can see that price dips down and SPY & QQQ market trends have flipped bearish on all timeframes, while VIX continues to be bullish(validating the downwards price action)
Customizable Settings
Users can adjust settings such as dashboard placement, trend speed mode, and color themes to suit individual trading styles.
In the image below, we can see the dashboard placement setting offers four different locations the user can move the dashboard. Just like in Gorb Algo , the user can choose which trendline speed they want to use to best fit their trading strategy.
In the image below, we can see the "bullish trend" & "bearish trend" colors setting. These colors by default match the rest of our suite of indicators, white is bullish and purple is bearish. Users can change these color settings to meet their preferences.
In the image below, we can see there are three market ticker options that the user can change. This allows users to monitor their favorite tickers across or easily flip through multiple tickers in order to gauge their current market trends without having to change their chart
In the image below, we can see the 4 timeframes that are on the dashboard. The user has the ability to change each of those four, to whatever timeframe best suits their trading needs. There are 12 different timeframe options to choose from.
Quick Dashboard Review
Using color-coded trend detection, this quickly gauges market trends and provides a visual to easily identify these changes in real-time across multiple timeframes. When a circle changes color, this means that price has flipped that direction, causing a change in the Gorb Algo market trendline. As stated above, white is for bullish trend and purple is for bearish trend, but these colors can be changed to fit the users trading strategy and style. Each timeframe the user chooses will be updated in real-time, including the higher time frames like the daily & weekly. They have been modified to pull data a same speed the lower timeframes are.
This helps provide quick visual identification of real market trend changes as price action develops. It is best used in conjunction with other forms of technical analysis for a holistic trading approach.
Conclusion:
This indicator is designed to streamline market trend analysis, offering traders an innovative, efficient, and easy-to-use tool for making informed trading decisions. This tool complements our suite of indicators, providing unique market insights that are not typically available in traditional open-source scripts.
How to get access:
You can see the Author's instructions to get access to this indicator
RISK DISCLAIMER
All content, tools, scripts & education provided by Gorb Algo are for informational & educational purposes only. Trading is risky and most lose their money, past performance does not guarantee future results.
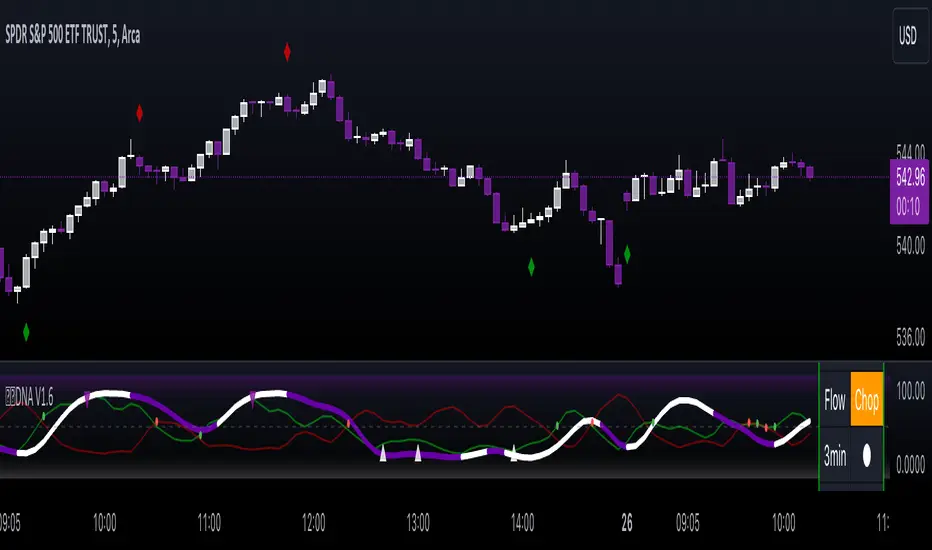
Gorb DNAIntroduction:
Gorb DNA is a versatile indicator using classic technical analysis components such as moving averages, stochastic oscillator, and histogram blending call/put flow analysis with our proprietary DNA algorithm. This indicator is designed to provide traders with useful market direction, volume, and momentum change visual cues.
Overview:
The Gorb DNA Indicator isn't just another momentum tool; it's a complex integration of innovative market analysis techniques.
By combining moving averages, stochastic oscillator, with proprietary algorithms, this indicator offers a multi-layered view of market trends, by merging call/put flow analysis with traditional market flow assessment.
This is designed for all kinds of traders, using a simple method to deliver visual changes in flow, volume, and momentum.
Core Features: Call/Put Flow & DNA
Call/Put Flow Analysis: This component examines the strength of market buying and selling pressures. It analyzes call (buying) and put (selling) flows using price range movements, providing insights smoothed over a defined period for analysis of market sentiment.
DNA Algorithm: A central feature of this indicator, the DNA algorithm utilizes a specialized moving average and oscillator technique to discern market trends. It presents an innovative approach, calculating the difference between bullish and bearish indicators to offer a detailed analysis of market momentum.
Visualization and Color Coding: The indicator employs a color-coded system for ease of interpretation, with distinct colors indicating different market conditions: white for upward/bullish movement and purple for downward/bearish movement. This feature translating complex data into a visual format that is simple to understand.
How Call/Put Flow Works:
Moving averages are used with volume and candlestick highs/lows over a specific range to help determine the overall flow. It then plots a colored line area that looks like a colored wave using just two colors to provide traders with a visual of the current market flow. This can help traders identify changes in sentiment with simple color cues.
How DNA Works:
A stochastic oscillator is used to measure the current price level relative to its price over a specific range period to analyze the momentum for the two DNA strands. Additionally moving averages are used to confirm trend and identify any divergences relative to the momentum. This is then plotted as two lines(DNA Strands) following the same color scheme as Call/Put Flow. When momentum is picking up in a specific direction, the lines will change colors and cross each other, this gives a visual of momentum now being fully on one side until it starts to change colors and flip that direction.
Custom Algorithm Elements:
Gorb DNA isn't just common tools combined into one indicator. It includes proprietary algorithmic elements tailored to enhance technical analysis and timing. These are the reasons what set this indicator apart from common momentum, sentiment, and volume methods.
We recommend experimenting with these features to choose what best suits your trading style.
Settings:
All skill-level friendly presets, easy to enable features with one-click
Call Flow: allows the user to plot a colored area that looks like waves showing increases/decreases in bullish volume (not to be followed blindly)
Put Flow: allows the user to plot a colored area that looks like waves showing increases/decreases in bearish volume (not to be followed blindly)
DNA Strand 1: allows the user to plot one of the algorithm lines to visualize momentum direction (not to be followed blindly)
DNA Strand 2: allows the user to plot one of the algorithm lines to visualize momentum direction (not to be followed blindly)
DNA Strength: allows the user to a histogram displaying momentum volume bars in the background
Flow Threshold: allows users to plot a dotted line to identify when call/put flow is now above average flow range
All colors are changeable for the user to customize to their liking
Call/Put Flow & DNA Demonstration
In the image below, we can see a basic illustration of how these core features function.
As stated above, call/put flow carefully monitors changes in moving averages, volume, and price action. If the market sentiment is shifting one direction, the call/put flow will plot those changes. If market is bullish, call flow should rise and put flow should decrease. The same goes for the opposite if the market is bearish.
As is the same for the DNA strands, if markets momentum is becoming bullish, the lines will change color and then cross to signify a change in momentum and the call flow in the background should match this change. This creates two layers of confluence in an easy understandable visual method.
Using Call/Put Flow
In the image below, we disabled everything but call flow to demonstrate usage.
On the left side of the image, you can see call flow matched price increase, then started to decline. This created a flow divergence, identifying a possible change in price action coming. This happened once flow crossed back below the threshold line and price then beginning to move lower. On the right side of the image, you can see call flow rising and price increasing. This is a good confluence showing there is bullish sentiment building in the market.
In this next image, we disabled everything but put flow to demonstrate usage.
The left side shows a put flow divergence. Put flow is slowly rising just like price is, this can help a trader identify a possible shift in sentiment coming. And on the right side, we have put flow rising above the threshold line and price beginning to decrease. Now we have confluence of bearish sentiment building in the market.
The image below shows only call & put flow enabled, to display what the above two images combined look like.
As you can see in the image above, these flow visuals help identify the underlying market sentiment. And when they cross, it leads to a change in price action in the direction of the sentiment over the threshold line.
Using DNA Strands
The image below has just DNA strands enabled to demonstrate usage.
On the left is a box highlighting bearish momentum cross. In the circles is the change in momentum shifting from bullish to bearish. The move gets stronger as the DNA strands get closer to cross over signifying strength in the move. On the right side is a box highlighting a bullish momentum cross. The circles again, show the change from bearish to bullish momentum. Like previously said, the move gets stronger as the DNA strands get closer to crossing over, signifying strength in that direction.
The next image shows call/put flow and DNA strands enabled for a full complete picture.
The circles labeled (1) are showing the change in momentum from bullish to bearish. Circle (2) shows call flow decreasing and put flow rising above calls. Finally the arrow points to the DNA strands crossing over and put flow rising above the threshold line. This is 3 levels of easy visual confluence showing a change in sentiment, volume, and momentum to the downside.
The next image will be showing the bullish side with call/put flow and DNA strands enabled.
The circles that are labeled (1), show the visual change in momentum on the DNA strands from bearish to bullish. Circle (2) is the crossing of call flow over put flow and the arrow points to the DNA strands crossing over and call flow above the threshold line. Three simple to use visual confluences to identify change in sentiment, volume, and momentum to the upside.
Conclusion:
Our goal is to provide a unique, yet simple approach to market sentiment & momentum analysis. It's a tool developed for traders seeking user-friendly and easy to use tools that provide easy visual insights of market dynamics. We believe in simplicity, effectiveness, and creating tools to support decision making for all traders.
How to get access:
You can see the Author's instructions to get access to this indicator
RISK DISCLAIMER
All content, tools, scripts & education provided by Gorb Algo are for informational & educational purposes only. Trading is risky and most lose their money, past performance does not guarantee future results.
Gorb AlgoIntroduction:
Gorb Algo is an all-in-one trading indicator made up of classic technical analysis components such as moving averages, relative strength index, stochastic oscillator, and pivot points blended together to create a synergistic algorithm. Focused on providing useful signals & trading tool overlays to meet all trader's technical analysis needs. Each feature included can be changed to meet each traders strategy or market condition.
Overview:
The Gorb Market Trend isn't a simple trend-following tool; it's a sophisticated blend of traditional and innovative methods, providing comprehensive market analysis.
Its unique combination of EMA analysis, volume weighting, RSI, and stochastic indicators, along with proprietary algorithms, providing nuanced views in trend detection and trading confluences.
The indicator is designed for traders at all levels, offering a balance of depth for experienced traders and simplicity for beginners.
Centerpieces: Gorb Market Trend & Volume Strength
These use a color-coded system to indicate market direction/strength. The color: white is used to signal upward/bullish trend, while the color: purple is used to signal downward/bearish trend. It is designed for ease of use, simplifying complex market data into an easy visually understandable format.
How the Gorb Market Trend Works:
Moving averages are used to find convergence or divergence on multiple EMA's to help determine the overall market direction. Relative Strength Index is used to assess the speed and change of price movements to add another layer to the Market Trend lines identification of the markets analysis. It then plots a line using just two colors to provide traders with a visual representation of the trend. This can help traders quickly grasp the current market trend with simple color cues.
How the Volume Strength Works:
A stochastic oscillator is used to measure the current price level relative to its price over a specific range period to capture sentiment and potential reversals for the Trend Strength feature. And the final part is the use of VWAP and volume analysis to ensure that identified trends are not only based on price movements but are also supported by trading volume, adding a layer of reliability to the trend signals. These are then plotted at the bottom of the chart following the same color scheme as Gorb Market Trend. Only difference is, when volume strength begins to decline, the color will be more transparent, and when it is strong, the color will be bright.
Custom Algorithmic Elements:
The Gorb Market Trend isn't just a combination of standard indicators. It includes proprietary algorithmic elements tailored to enhance signal accuracy and timing. These unique components are what set the Gorb Market Trend apart from conventional trend-detection methods.
We recommend exploring every feature to pick & choose what best suits your needs and style of trading, and use that to combine with the Market trend line.
Features:
All skill-level friendly presets, easy to enable features with one-click
Trading Signals: Plotted signals to help traders identify changes in trend on the Gorb Market Trend Line (not to be followed blindly)
Match Volume Color: allows the user to enable signals to appear only if they match the trend strength's color
Enable MA Filter: allows the user to use 2 EMA's to create a custom trend filter in order to limit contrarian signals with the current trend
Chop Filter: allows the user to have a specific candle range of their choice to limit signals during sideways price movement
4 EMA's: allows the user to plot up to 4 EMA's on the chart and change to the users specific trading strategy with the Market Trend line
VWAP: allows users to plot VWAP on their chart to visually see where price is relatively
EMA Clouds: allows users to fill the gap between EMA's plotted on the chart to help them visualize zones for entries or stop-losses
Pivot Points: allows users to have pivots on their chart to use in tandem with market trend line to find areas of support and resistance to help find confluence in their trading
All colors are changeable for the user to customize the scheme to their liking or style
Basic Signals, Market Trend & Volume Strength Demonstration
In the image below, we can see a basic example of how these 3 core features function.
As explained above, the trade ideas are only generated if the user enables them. They will plot as small triangles in real time and are directly correlated to the market trend line coloring in order to quickly see the change in market conditions.
The volume strength on the bottom helps identify the strength and momentum of the market condition. This can also be used to identify possible fake-outs or small pullbacks before price continues on. The brighter the volume strength the stronger it is, when it is dimmer, that means volume is decreasing in that direction. This can help traders identify signals they may not want to trust as much.
Trading Tool Overlays with Signals
In the image below, we have enabled the EMA's and VWAP overlays from the settings. By using these tools, users can add more confluence to create their trading strategies
The EMA's are not only used for the market trends, trend filter. But also used as an additional confluence for general trend following purposes alongside the trade idea signals. These can be extremely useful for traders who like to have different length moving averages depending on their timeframe for analyzing the market.
In this next image, we can see that price dips down and then bounces up. With EMA clouds enabled, the user can now have visual zones to look for trade entries in.
When paired with the market trend line and trade idea signals, this adds a whole other level of easy visual trading confluence for traders. You can see that market trend changes color and a trade signal is plotted when price enters these zones. This can be helpful to a trader looking to find confluence in their entries.
The image below shows specific pivot levels being plotted when the user enabled pivots in the settings of the indicator.
The pivot levels proved an excellent area of support/resistance for traders that are generated fresh every day. These are particularly useful for areas that line up with previous tools above and trade signals. This overlay gives traders a clear level that can be used to confirm entries and create targets to exit trades at. These levels when combined with the other tools in this indicator provide traders an all-in-one visual confluences. Some traders may just use this overlay to have an idea on the range for the trading session.
Filters:
There are 3 different trade signal filters integrated into this indicator
1. Match Volume Color: When enabled, signals can only be valid and plotted if the volume strength color matches the market trend line signal. Otherwise the signal will not appear, this limits possible fake-outs without having volume agree.
2. MA Filter: When enabled, this removes an contrarian signals to the current market trend per the settings of the filter. The EMA settings for this filter can be changed by the user for them to customize this to their trading strategies. There are two settings, short ema and long ema to define the trend.
3. Chop Filter: When enabled, this disables signals that would normally appear in sideways price action. This setting is also customizable by the user; there are two settings: candle period and threshold. The candle period is how many candles back does this filter want to look to define its range. The threshold, is the amount of price deviation is allowed from this range in order to disable a signal.
Conclusion:
We believe in providing an all inclusive trading tool to help simplify trading for all traders. The goal is to provide a user-friendly, efficient tool that provides insights into market trends. For it to stand out for its simplicity and effectiveness, as a support tool for decision making.
How to get access:
You can see the Author's instructions to get access to this indicator
RISK DISCLAIMER
All content, tools, scripts & education provided by Monstanzer or Gorb Algo LLC are for informational & educational purposes only. Trading is risk and most lose their money, past performance does not guarantee future results.
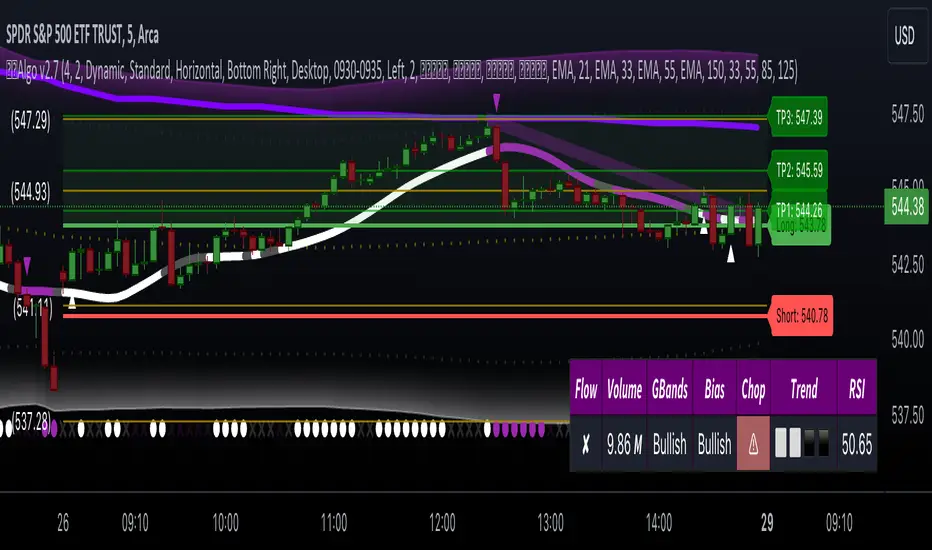
BE - Strategy Builder ToolkitIndicator vs Toolkit:
This is definitely not an indicator, hence this doesn't do any kind of analysis nor provide meaningful outputs where you can take trading decisions out of it.
This is a Strategy Builder Toolkit which works like any other broker/3P applications, which helps traders to build their own custom/ predefined strategies, save / deploy them at their wish.
Idea Behind Developing this Toolkit: I am sure many of traders have overcome scenarios where, on break of x level he wants to initiate straddle else he wants to initiate Iron Condor. Some of them wants to deploy custom strategies only at certain time or at certian price levels.
It becomes pretty difficult to track markets when you are away from desk and if you dont adjust the strategy legs, you are incurring big drawdowns. There are many if's and buts to deploy strategies.
To overcome such challenges, i have built this toolkit.
Note: As this is just a toolkit, you should conduct your analysis to gauge the market direction outside the perview of this. Once you know the view / direction of the script. you can use this toolkit in action to
1. Deploy Strategy at (Desired levels| Desired time|Confired Levels|Confirmed Volumes)
2. Strategy can be Prebuilt / Custom Built
3.1 Set SL, Target for Directional view (Trail SL aswell)
3.2 Set Upside or Downside Target for Non Directional view (Trail SL aswell)
3.3 let the strategy play with out SL|Targets for consolidation view.
4. Adjust Legs by closing existing position and opening fresh position or place fresh adjustments
5. Book partial Profits with in the zone.
How the Toolkit is buit: Script uses text related functions to understand the custom input given in the indicator and coverts into a strategy and deployes them as a algo trading (Next Level Bot) with the additional parameter set for SL|Target|Entry levels.
Understanding the settings:
1. Strike Difference: is basically a value between each strike. eg: Banknifty : 100, Nifty & Finnifty: 50
2. 1 Lot Qty: Qty per Lot accepted by exchange|Broker. eg: BNF: 15, Nifty: 50, Finnifty: 40
3. Lot Multiplier: If you build strategy with 1 lot and if you set the Lot multiplier as 2 then strategy gets deployed with 2 lots. for eg. If i have saved strategy to buy BNF 1 ITM with 1Lot and have set lot multipier to 3 then at the time of deploying the trade it pushes as 3 lots (3 * 15Qty per lot = 45Qty) of 1 ITM strike.
4. Symbol Name: Select the Symbol Name here.
5. Current & Next Week Expiry Date: Specify the expiry Dates in the format as supported by your broker.
6. Broker Name, Exchange & Product Type: hope it is self explanatory.
IMPORTANT settings to understand:
7. Triggere Entry Post (optional): You have to specify when you want to deploy the strategy. For instance, if i want to deploy my strategy at 30 min after market open which is 9:45 am, then i have specify as 0945. Another instance where i want to close my strategy at 3 PM then you have to specify as 1500. Uncheck this option if you are not worried about the time of entry.
My personal Used Case: On the Expiry -1 Day at 0916 (9:16AM) i will buy 6 lots of 8OTM PE & CE and Sell 2 lots 7OTM, 2 lots of 6OTM and 2 lots of 5OTM and close the trade by 1100 (11AM).
8. Price Levels (Confirmed vs UnConfirmed) (Optional): Confirmed is basically price is sustained at|around the specified price level, where in UnConfirmed is basically the touch of the specified level.
for instance if i want to deploy straddle only if price is sustained at 100. then, i would specify GE with 100 in price input settings, and check thee Confirmed price box. Assuming if LTP is running at 98 and with the above settings it will only deploy the trade upon price is sustained at 100 level for 3 to 5 candles not at the touch of 100.
Uncheck this option if you are not worried about the Entry Price.
9. Confirmed Volume (Optional) (Long or Short): Basis your view|direction of the strategy. you can get additional confirmation. At the time of entry you want volume to be present towards the direction of the strategy. Uncheck this option if you are not worried about the volume or Volume doesn't exist for the chart loaded.
10. Alert Types: It consists of 3 Long & 3 Short directional (prebuilt) strategy along with Close Strategy, Close Specified Symbols Only & Design Custom Strategy Option.
10.1 : Slow Upmove - If you are having bullish view and predict that prices shall go slow and steady. This strategy can be deployed where you get the benifit of time decay as well while the delta play in favor of you. (viseversa for Slow DownMove)
10.2 : Fast Upmove - If you are having bullish view and predict that prices shall go fast. This strategy can be deployed where you get the smaller benifit of time decay as well while the delta play in favor of you. (viseversa for Fast DownMove)
10.3 : Vol Upmove (Volatality)- If you are having bullish view and predict market is tend to be volatile. This strategy can be deployed where you get the benifit of volatility as well while the delta play in favor of you. (viseversa for VolDownMove)
10.4 : Close Trade - You can use this option close the deployed strategy completely.
10.5 : Close Symbols - You can use this option close few of the symbols for the strategy deployed.
10.6 : Custom: Use this option to design you own custom strayegy with the syntax below:
Sample 1:
N|B|C2|3
N refers to Nextweek Expiry (if C is used then Current week expiry)
B refers to Buy (if S is used then Sell)
C refers to Call | CE (if P is used then PE or Put)
2 refers to 2OTM (for CE any Postitive number refers to as OTM and for PE it will be treated as ITM strikes & 0 refers to as ATM - viseversa for Negative Numbers)
3 refers to as 3 Lot
With the syntax of N|B|C2|3 - strategy will be deployed as "Buy 3 lots of 2 OTM Call of Next expiry"
Sample 2:
C|S|P-3|3|10|30
Above syntax means: SELL Current Expiry 3 Lots of 3 OTM Put Strike with 10 SL and 30 TGT
Sample 3:
C|S|C10|3|Default
Above syntax means: SELL Current Expiry 3 Lots of 10 OTM CALL Strike with 50% SL and 95% TGT
Sample 4:
C|B|C-2|3|40%|50%
Above syntax means: BUY Current Expiry 3 Lots of 2 ITM CALL Strike with 40% SL and 50% TGT
Sample 5: Long Straddle
C|B|C0|3
C|B|P0|3
Above syntax means: BUY Current Expiry 3 Lots of ATM CALL & PUT Strike
Sample 6: Iron Butterfly
C|B|C1|1
C|S|C0|1
C|S|P0|1
C|B|P-1|1
Above syntax means: Sell Current Expiry 1 Lots of ATM CALL & PUT Strike and BUY 1OTM Call & Put Strike
Sample 7: Diagonal Spread
C|S|C2|1
C|S|P-2|1
N|B|C3|1
N|B|P-3|1
Above syntax means: Sell Current Expiry 1 Lots of 2OTM CALL & PUT Strike and BUY 3OTM Call & Put Strike of Next Expiry.
To Understand how to deploy Strategy with defined Adjustments. For instance i want to deploy Iron Condor with Adjustments for BNF when the price is currently running at 45000.
C|B-|C3|1
C|S*|C2|1
C|B--|P-3|1
C|S**|P-2|1
At:2|C|S|C2|1
At:2|C|B|C3|1
At:-2|C|S|P-2|1
At:-2|C|B|P-3|1
On:2|*
On:-2|**
On:2|-
On:-2|--
With the above syntax: Intial trades are placed with
BUY BANKNIFTY45300CALL(Current Expiry) 1 Lot
BUY BANKNIFTY44700PUT(Current Expiry) 1 Lot
SELL BANKNIFTY45200CALL(Current Expiry) 1 Lot
SELL BANKNIFTY44800PUT(Current Expiry) 1 Lot
Toolkit tracks the price and holds the adjustments.
We may start to bleed on the sold leg (45200CALL) once the price crosses 45200. Hence if the price crosses 2 strike upside as specified with syntax " On:2|* " where * is a character tagged to Sold Call Leg. it closes the 45200 Call.
Similarly, " On:2|- " where - is character tagged to Brought Call Leg. it closes the 45300 Call, as soon as prices reaches 2 strike upside.
At:2|C|S|C2|1
At:2|C|B|C3|1
With the At Statements you can place the fresh adjustments legs. Above syntax refers to Once the price reaches 45200 it places below adjustment legs.
BUY BANKNIFTY45500CALL(Current Expiry) 1 Lot
SELL BANKNIFTY45400CALL(Current Expiry) 1 Lot
Note: Similarly If prices reaches downside with the On and At Sytax it places the necessary adjustment legs accordingly.
11. SL & TGT - You can specify SL, TGT or Upside & Dowside TGT during the entry conditions and Stratey shall be closed upon hitting either the SL or TGT accordingly.
12. On % Tgt & Lock % SL: This option is used for Prebuilt strategy where you can lock the Profit | Set Revised SL upon hitting specified TGT percentage.
13. Close Symbols: This option is used if you select Alert type as Close Symbols (Ref - 10.5 : Close Symbols) for specified list of symbols Alert shall be pushed to close the open positions of those symbols.
DISCLAIMER: No sharing, copying, reselling, modifying, or any other forms of use are authorized for our documents, script / strategy, and the information published with them. This informational planning script / strategy is strictly for individual use and educational purposes only. This is not financial or investment advice. Investments are always made at your own risk and are based on your personal judgement. I am not responsible for any losses you may incur. Please invest wisely.
Happy to receive suggestions and feedback in order to improve the performance of the indicator better.
