Pro Algo Reversal 1 Signal No Repaint/No Lagging
This is a Reversal trading signal system (part 1) for any range markets. It’s better used with timeframe from 15 min to 60 min for day trading or swing trading. It generates reversal signals for the important turning point bars and candles with no repaint and no lagging.
How does it work?
* Defines support/resistance(S/R) levels based on floor trader’s pivot points and my own S/R levels.
* Calculates the reversal signals, price reactions close to all above S/R levels.
* Generates reversal trading signal: buy/long or sell/short based on all combined factors.
What are the Reversal signals?
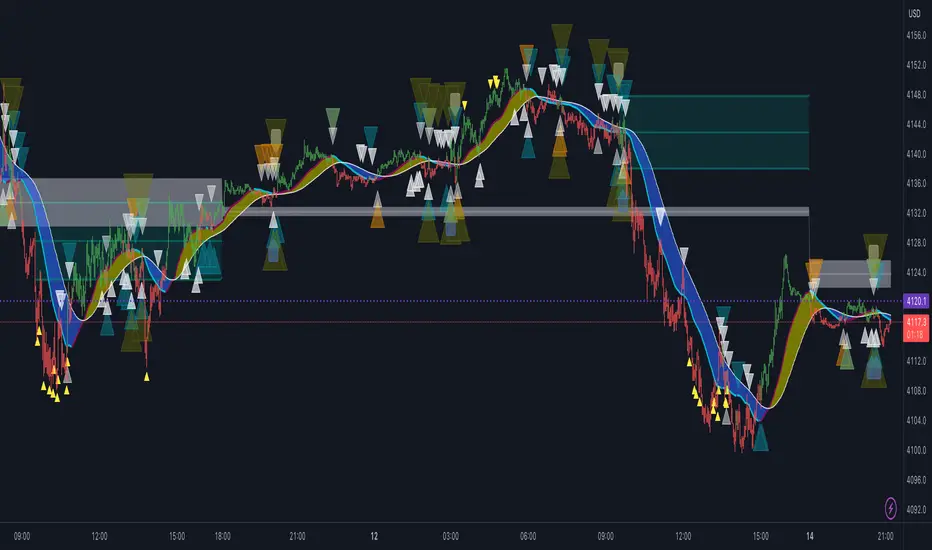
* Blue arrow means trend is reversed to bullish
* Pink arrow means trend is reversed to bearish
How to use?
* Blue up arrow : Buy(Long) or continuous Buy(Long)
* Pink down arrow : Sell(Short) or continuous Sell(Short)
* Have to increase time frame to reduce signal noises, prefer 15-60 min.
* There is no way to filter all noises even with higher time frame, all the trades must have a stop.
How to access?
* PM me to obtain access
* 10 day Free Trial is available
Algo
Pro Algo Scalping/DT/ST No Repaint/No Lagging by@ProKingTV This is a bar-by-bar trading signal system for scalping, day trading or swing trading on all time frames. It generates ONE signal(buy/sell or long/short) for the most of important bars and candles with no repaint and no lagging.
How does it work?
* Defines all support/resistance(S/R) levels based on floor trader’s pivot points and my own S/R levels.
* Calculates the trend/reversal signals, price reactions close to all above S/R levels.
* Generates one trading signal: buy/long or sell/short based on all combined factors.
What are the signals?
* Blue Arrow signals are bullish
* Pink Arrow signals are bearish
How to use?
* Blue Up Arrow : Buy(Long) or continuous Buy(Long)
* Pink Down Arrow : Sell(Short) or continuous Sell(Short)
* Increase time frame to reduce signal noises, but will generate less trading opportunities.
* There is no way to filter all noises even with higher time frame, all the trades must have a stop.
* This indicator is highly sensitive to a price change and reversal signals will be generated immediately.
How to access?
* PM me to obtain access
* 10 day Free Trial is available

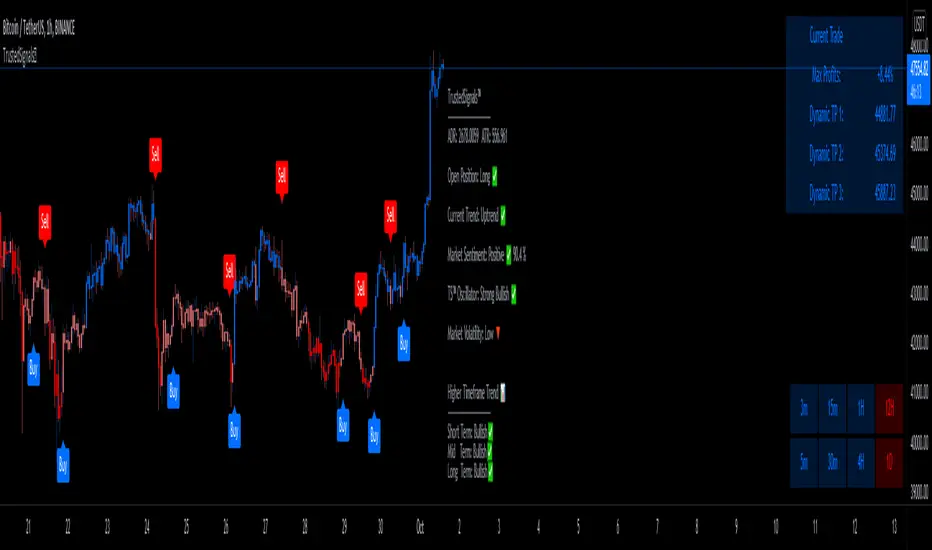
TrustedSignals™TrustedSignals Indicator includes standard Buy and Sell signals on the chart, Support & Resistance lines, Auto-Trendlines, AutoFibs and an All-in-One Market Dashboard.
(All these signals can be set up as Live Alerts directly in Tradingview)
The 2 main Input options for this algorithm are ' Reactivity ' and ' Depth '. By default, the indicator is added to your chart with the best settings we've found so far.
-The ' Reactivity ' controls how quickly the algorithm reacts to trend changes. The higher the reactivity, the fewer trades on the chart. If the Reactivity input is low, the algorithm will react more quickly, and show more frequent trades.
-The ' Depth ' controls the position of the signals relative to the trend swing. A lower Depth will allow for more frequent and earlier entries, while a higher Depth will give slower entries.
Our third (secondary) input is ' Trend Length ' (the Lookback of the ' Current Trend ' indicator). TrustedSignals™ is coloring the candles based on the current trend direction. The blue color shows an uptrend, while the red color shows a downtrend. Buy and Sell signals alerted while the current trend is showing pink (Sideways Market) should be taken carefully, as the market direction is not decided.
Since we believe in the idea of an ' All-in-One ' Indicator, we have included 3 more extremely useful and powerful trading tools.
-The first optional feature is the ' Support and Resistance ' lines. This feature can be activated to draw the key levels of Support and Resistance, easing your decision making and reinforcing the entry signals. Those levels can also be used as Stop Loss or Take Profit
-The second optional feature is the ' Auto-Trendlines '. This part of our amazing indicator automatically draws Trendlines based on the Lookback period the user inputs.
-The last and most important optional feature is the ' AutoFibs '. TrustedSignals™ will automatically draw Fibonacci Retracement levels from trend swing key points. (the lookback length can be adjusted by the user)
- Market Dashboard -
Within one simple panel on your chart, our Dashboard displays the most relevant data from all of our features in real-time.
Current Trend
(The bar color) is an indicator based on Murrey Math's lines. These lines are based on the idea that according to Gann, price moves in 1/8's that act as points of support and resistance. Given this 1/8 characteristic of price action, we assigned properties to each of the lines in a given octave, obtaining a perfect Trend Indicator shown by the candle color, ranging from red to orange to blue.
Market Sentiment
Market Sentiment is a zero lag, 'noise-free', custom improved version of the old 'Relative Strength Indicator ( RSI )' It measures trend velocity and momentum, while it charts the current and historical strength or weakness of the market. It is a much more accurate and vastly superior than the usual RSI.
Trusted Sginals Oscillator
TS Oscillator is our own branded indicator used to measure market momentum and determines whether bullish or bearish trend dominates the market. It measures the market momentum, with the aim to detect potential trend direction. Helping you to identify if the price is high or low in comparison to the recent price behavior.
Outputs: "Strong Bearish ", "Weak Bearish", "Strong Bullish ", "Weak Bullish"
Higher Timeframe Trend is a trend indicator based on our own non-repainting calculation of higher timeframe trend. It is based on a custom method that builds synthetic support and resistance lines from higher time, without repainting, while keeping the output extremely accurate.
Use the link below to obtain access to this indicator
!BooM!Hello
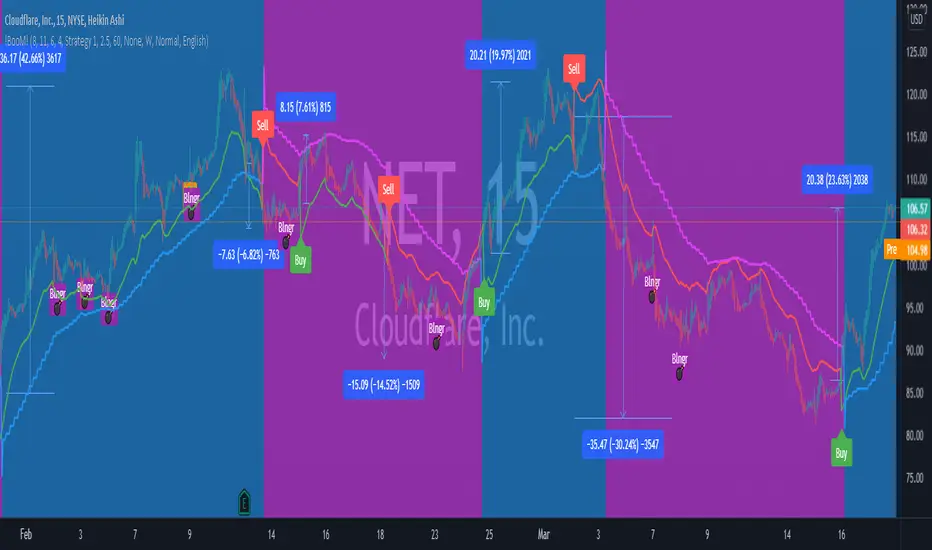
The indicator measures the relationship between Average True Range (ATR) that shows how much an asset moves, on average, during a given time frame and Standard Deviation that measuring how widely asset prices are dispersed from the average price. If prices trade in a narrow trading range, the relationship between the ATR and SD will return a low value that indicates low volatility that will lead to potential price quick movement.
To increase the accuracy of the indicator and reduce false signals, it generates three circles, each indicate protentional price quick movement coming. For circle to print, following criteria must meet:
• Green Circle is based on low volatility and both ATR and SD are at minimum value for a short pre-defined time frame.
• Magenta Circle is based on low volatility and SD are at minimum value for a long pre-defined time frame.
• Yellow Circle is based on low volatility and SD are at minimum value for a short pre-defined time frame and Average Directional Movement Index reaching to pre-defined level.
The indicator focuses mainly on identifying potential price quick movement. However, it is equipped with two signal that is generated upon crossing the keltner channel upper or lower bands to help identifying the direction of the price movements but the user shall study the chart on big time frame to confirm the direction of the price movement.
If you would like to use it, please drop a message or find other contact under my signature.
After purchase, open the TradingView indicator library. Under the Invite-Only Scripts section, you will see it. Add it to your chart and save your chart layout.
RogTrader AlgoA simple BUY/SELL algorithm based on Moving Averages (EMA), MACD, RSI, Stochastic, ADX, ATR, CCI, OBV, Pivot Points, and Parabolic Sar, and Volume averaged.
Simple algo that uses multiples indicator strengths and weight them to generate buy and sell signals
Indicator strengths are displayed on each candle (green is bullish and red is bearish)
Green Buy and Red Sell shall be primarily used for long positions
Bull and Bear Strengths are created based on Price Action, and Volume, the length of the array shows upward or downward strength
Indicators' Signal Strength shows number Indicators' indication for the direction.
Bollinger Bands are in red and green filled
VWAP Bands are in gray, green, and red
Linear Regression is the blue line
Check multiple timeframes.

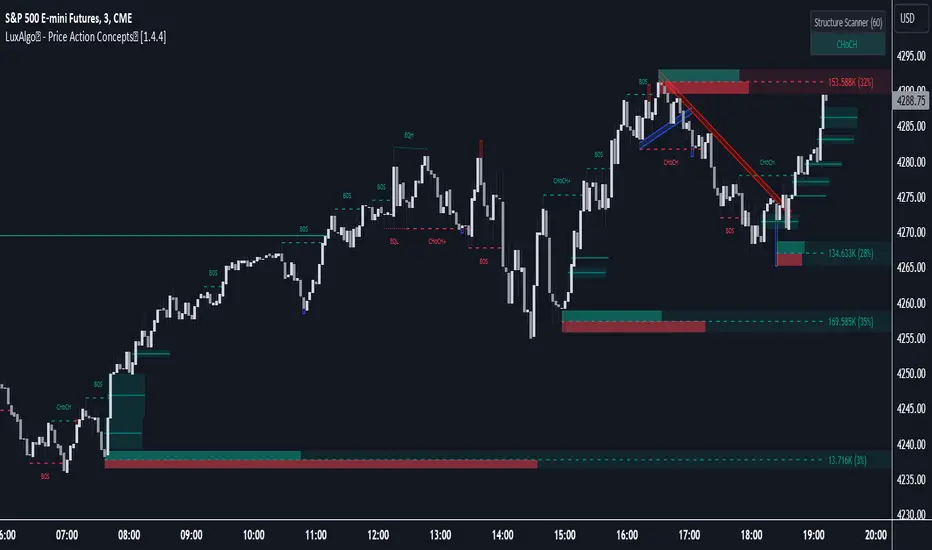
LuxAlgo® - Price Action Concepts™Price Action Concepts™ is a first of it's kind all-in-one indicator toolkit which includes various features specifically based on pure price action.
Order Blocks w/ volume data, real-time market structure (BOS, CHoCH, EQH/L) w/ 'CHoCH+' being a more confirmed reversal signal, a MTF dashboard, Trend Line Liquidity Zones (real-time), Chart Pattern Liquidity Zones, Liquidity Grabs, and much more detailed customization to get an edge trading price action automatically.
Many traders argue that trading price action is better than using technical indicators due to lag, complexity, and noisy charts. Popular ideas within the trading space that cater towards price action trading include "trading like the banks" or "Smart Money Concepts trading" (SMC), most prominently known within the forex community.
What differentiates price action trading from others forms of technical analysis is that it's main focus is on raw price data opposed to creating values or plots derived from price history.
Mostly all of the features within this script are generated purely from price action, more specifically; swing highs, swing lows, and market structure... which allows users to automate their analysis of price action for any market / timeframe.
🔶 FEATURES
This script includes many features based on Price Action; these are highlighted below:
Market structure (BOS, CHoCH, CHoCH+, EQH/L) (Internal & Swing) multi-timeframe
Volumetric Order Blocks & mitigation methods (bullish & bearish)
Liquidity Concepts
Trend Line Liquidity Zones
Chart Pattern Liquidity
Liquidity Grabs Feature
Imbalance Concepts MTF w/ multiple mitigation methods
Fair Value Gaps
Balanced Price Range
Activity Asymmetry
Strong/Weak Highs & Lows w/ volume percentages
Premium & Discount Zones included
Candle Coloring based on market structure
Previous Highs/Lows (Daily, Monday's, Weekly, Monthly, Quarterly)
Multi-Timeframe Dashboard (15m, 1h, 4h, 1d)
Built-in alert conditions & Any Alert() Function Call Conditions
Advanced Alerts Creator to create step-by-step alerts with various conditions
+ more (see changelog below for current features)
🔶 BASIC DEMONSTRATION
In the image above we can see a demonstration of the market structure labeling within this indicator. The automatic BOS & CHoCH labels on top of dashed lines give clear indications of breakouts & reversals within the internal market structure (short term price action). The "CHoCH+" label is also demonstrated as it triggers only if price has already made a new higher low, or lower high.
We can also see a solid line with a larger BOS label in the middle of the chart. This label demonstrates a break of structure taking into account the swing market structure (longer term price action). All of these labels are generated in real-time.
🔶 USAGE & EXAMPLES
In the image below we can see how a trade setup could be created using Order Blocks w/ volume metrics to find points of interest in the market, swing / internal market structure to get indications of longer & shorter term reversals, and trend line liquidity zones to find more likely impulses & breakouts within trends.
We can see in the next image below that price came down to the highest volume order block marked out previously as our point of interest for an entry used in confluence with the overall market structure being bullish (swing CHoCH). Due to price closing below the middle Order Block at (24.77%), we saw it was mitigated, and then price revisited liquidity above the Trend Line zone above, leading us to the first Order Block as a target.
You will notice the % values adjust as Order Blocks are touched & mitigated, aligning with the correct volume detected when the Order Block was established.
In the image below we can see more features from within Price Action Concepts™ indicator, including Chart Pattern Liquidity, Fair Value Gaps (one of many Imbalance Concepts), Liquidity Grabs, as well as the primary market structures & OBs.
By using multiple features as such, users can develop a greater interpretation of where liquidity rests in the market, which allows them to develop trading plans a lot easier. Liquidity Grabs are highlighted as blue/red boxes on the wicks during specific price action that indicates the market has made an impulse specifically to take out resting buy or sell side orders.
We can notice in the trade demonstrated below (hindsight example) how price often moves to the areas of the most liquidity, even if unexpected according to classical technical analysis performed by retail traders such as chart patterns. Wicks to take out orders above & potentially trap traders are much more noticeable with features such as these.
The Chart Patterns which can be detected include:
Ascending/Descending Wedges (Asc/Desc Wedge)
Ascending/Descending Broadening Wedges (Asc/Desc BW)
Ascending/Descending/Symmetrical Triangles (Asc/Desc/Sym Triangle)
Double Tops/Bottoms (Double Top/Double BTM)
Head & Shoulders (H&S)
Inverted Head & Shoulders (IH&S)
General support & resistance during undetected patterns
In the image below we can see more features from within the indicator, including Balanced Price Range (another imbalance method similar to FVG), Market Structure Candle Coloring, Accumulation & Distribution zones, Premium & Discount zones w/ a percentage on each zone, the MTF dashboard, as well as the Previous Daily Highs & Lows (one of many highs/lows) displayed on the chart automatically.
The colored candles use more specific market structure analysis, specifically allowing users to visualize when trends are considered "normal" or "strong". By utilizing other features alongside this market structure analysis, such as noticing price retesting the PDL level + the Equilibrium as resistance, a Balanced Price Range below price, the discount with a high 72% metric, and the MTF dashboard displaying an overall bearish structure...
...users can instantly gain a deeper interpretation of price action, make highly confluent trading plans while avoiding classical technical indicators, and use traditional retail trading concepts such as chart patterns / trend lines to their advantage in finding logical areas of liquidity & points of interest in the market.
The image below shows the previous chart zoomed in with 2 liquidity concepts re-enabled & used alongside a new range targeting the same Discount zone.
🔶 SETTINGS
Market Structure Internal: Allows the user to select which internal structures to display (BOS, CHoCH, or None).
Market Structure Swing: Allows the user to select which swing structures to display (BOS, CHoCH, or None).
MTF Scanner: See market structure on various timeframes & how many labels are active consecutively.
Equal Highs & Lows: Displays EQH / EQL labels on chart for detecting equal highs & lows.
Color Candles: Plots candles based on the internal & swing structures from within the indicator on the chart.
Order Blocks Internal: Enables Internal Order Blocks & allows the user to select how many most recent Internal Order Blocks appear on the chart as well as select a color.
Order Blocks Swing: Enables Swing Order Blocks & allows the user to select how many most recent Swing Order Blocks appear on the chart as well as select a color.
Mitigation Method: Allows the user to select how the script mitigates an Order Block (close, wick, or average).
Internal Buy/Sell Activity: Allows the user to display buy/sell activity within Order Blocks & decide their color.
Show Metrics: Allows the user to display volume % metrics within the Order Blocks.
Trend Line Liquidity Zones: Allows the user to display Trend Line Zones on the chart, select the number of Trend Lines visible, & their colors.
Chart Pattern Liquidity: Allows the user to display Chart Patterns on the chart, select the significance of the pattern detection, & their colors.
Liquidity Grabs: Allows the user to display Liquidity Grabs on the chart.
Imbalance Concepts: Allows the user to select the type of imbalances to display on the chart as well as the styling, mitigation method, & timeframe.
Auto FVG Threshold: Filter out non-significant fair value gaps.
Premium/ Discount Zones: Allows the user to display Premium, Discount , and Equilibrium zones on the chart
Accumulation / Distribution: Allows the user to display accumulation & distribution consolidation zones with an optional Consolidation Zig-Zag setting included.
Highs/Lows MTF: Displays previous highs & lows as levels on the chart for the previous Day, Monday, Week, Month, or quarter (3M).
General Styling: Provides styling options for market structure labels, market structure theme, and dashboard customization.
Any Alert() Function Call Conditions: Allows the user to select multiple conditions to use within 1 alert.
🔶 CONCLUSION
Price action trading is a widely respected method for its simplicity & realistic approach to understanding the market itself. Price Action Concepts™ is an extremely comprehensive product that opens the possibilities for any trader to automatically display useful metrics for trading price action with enhanced details in each. While this script is useful, it's critical to understand that past performance is not necessarily indicative of future results and there are many more factors that go into being a profitable trader.
🔶 HOW TO GET ACCESS
You can see the Author's instructions below to get instant access to this indicator & our premium suite.
[Study] GreenCrypto Signal You can find the backtesting result of this indicator in here:
This indicator majorly uses MA, Tilson and S&R. MA is used for predicting the trend, Instead of normal cross-over of the MA, we are calculating the trend of the MA itself (whether MA is moving upward or downward by comparing the previous and current value of MA), along with MA we also use Tilson to calculate the MA.
Once we have MA and Tilson we take average and merge both MA and Tilson MA to get a double confirmation on the trend of the market. for entry and exit we use S&R with the merged MA, if the trend change is at the support or resistance level we go for LONG/SHORT respectively. Here we are doing continuous LONG+SHORT position, this provides more opportunity to capture unexpected market trend.
Enter a Long Trade when the script shows "Long" and exit either when you get "Short" signal or when it meets your target.
Parameters:
"Use 1:EST, 2:SST, 3:HST ?" : Select EMA , SMA or HullMA (works best on HullMA)
Length: Length of the EMA / SMA /HullmA
Factor: Used for calculation of Tilson and the Support and resistance .
This indicator works best on 4H time frame but you can also use it on 1 day or higher timeframe charts
The default config present in this script is designed for ETH but it will also work with other coins)
Config for Specific Crypto coins (Please feel free to try out other configs also) :
ADA, BNB, EOS : "Use 1:EST, 2:SST, 3:HST ?" = 3
"Length" = 8
"Factor" = 0.9
ETC, XLM : "Use 1:EST, 2:SST, 3:HST ?" = 3
"Length" = 8
"Factor" = 0.85
Please DM me if you would like to tryout 7 Days free trail.
Thanks

Cluster Algo (Skoda Version)This Indicator operates similarly to the Cluster Algo marketed elsewhere. The key difference is the integration of Bollinger Bands, giving us clear indications.
Buy - When the signal line goes above the Bollinger basis line and is GREEN
Sell - When the signal line goes below the Bollinger basis line and is RED
Consider closing the trade when the signal line changes colour.
When the signal line goes outside the Bollinger band, this a strong indication price will rally.
If you require any further information or script modifications, please message me.
PLEASE CHECK OUT MY OTHER SCRIPTS

XBrat AlgoXbrat Algo
Think of an Experienced Traders’ Brain as a blueprint for a trading algorithm. Then the desire to keep charts as clutter free as possible. What you get is a blueprint of Paul Bratby’s thought process but even he admits, he is getting too old to focus on all of these at once!
By aligning various ‘Decision Points’ from multiple indicators such as a configuration of EMA’s, EMA Clouds, Stochastics, MACDs as well as a number of other indicators. Add this to experienced decision making, we have the basis of our Algo.
It’s not just indicators, it’s how they are combined and the settings of each individual indicator, which are not default, that makes up 12 Decision points for grading a trade.
• Minimum of 10 Decision Points before Paul considers grading the trade a 3* trade
• Then another special Decision Point will make it a 4* trade
• Another for 5* trade
• And Finally, a total of 12 Decision Points being correct before he grades a trade 6* trade

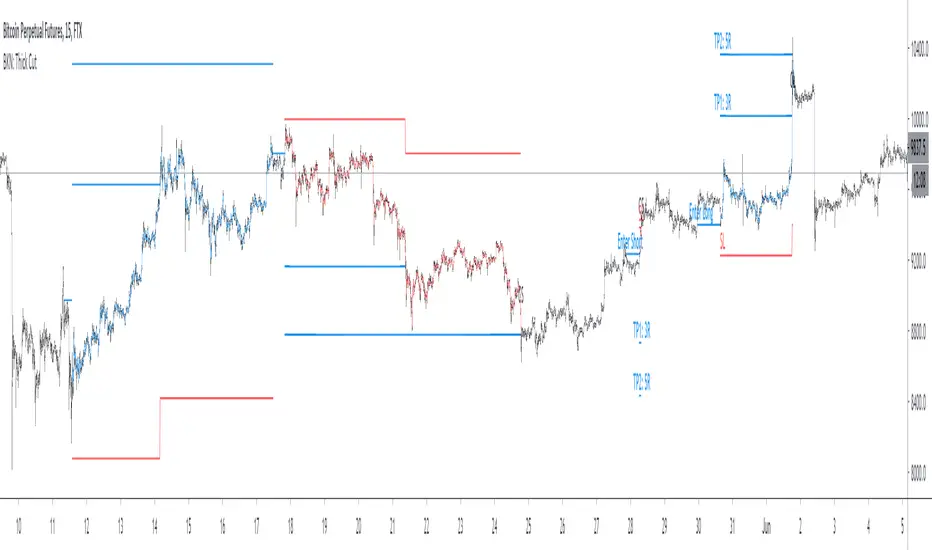
BKN: Thick CutThick Cut is the juiciest BKN yet. This indicator is created to take a profitable trading strategy and turn it into an automated system. We've built in several pieces that professional traders use every day and turned it into an algo that produces on timeframes as low as 1, 3, and 5 minutes!
Limit Order Entries: When criteria is met, an alert is signaled that will send a value to enter a position at a limit price.
Built in Stop Loss: A stop is built in and the value can be sent to your bot using the {{plot}} function or you can rely on a TradingView alert when the stop is hit.
Built in Take Profits: We've built in two separate take profits and the ability to move your stop loss to breakeven after the first take profit is hit. Even if you take 50% profit at 1R and move your stop loss, you already have a profitable trade. Test results show 50% profits at 2R and the remainder at higher returns result in exceptional results.
Position Sizing: We've built in a position size based on your own predetermined risk. Want to risk $100 per trade? Great, put in 100 in the inputs and reference a quantity of {{plot("Position Size")}} in your alert to send a position size to the bot. You can also reference {{plot("Partial Close")}} to pull 50% of the position size closing 50% at TP1 and 50% at TP2.
Backtest results shown are very short term since we are viewing a 15m chart. This can be a profitable strategy on many timeframes, but lower timeframes will maximize results.
A unique script with incredible results. Further forward testing is live.
***IMPORTANT***
For access, please do not comment below. Comments here will not be replied to. Please send a DM here or on my linked Twitter . At this time, this strategy is considered a Beta release as we continue to fine tune settings and more. Expecting 2 weeks of beta with official release around June 6.
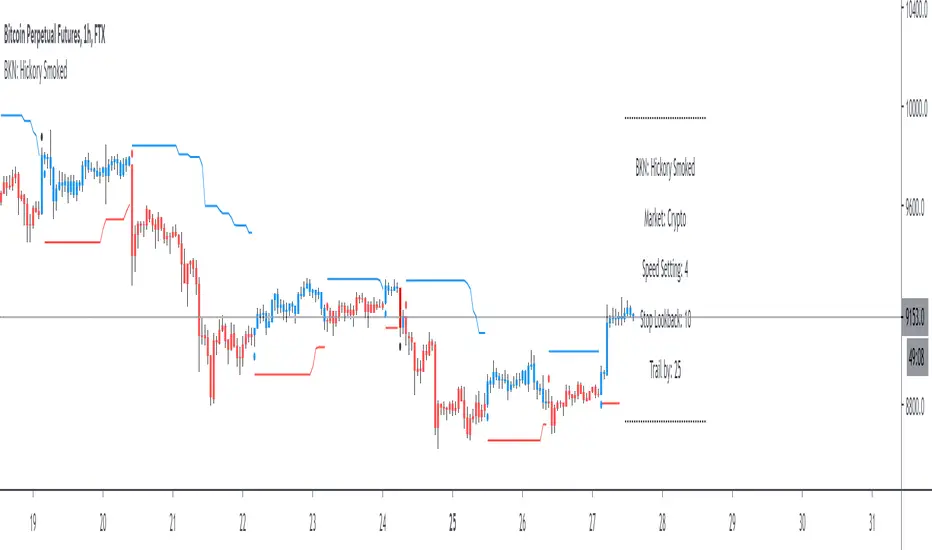
BKN: Hickory SmokedWelcome to the BKN: Hickory Smoked Indicator. This is an algorithmic indicator that thrives in trending environments. We've included settings for crypto and forex and speed options for lower timeframe entries.
The script offers a stop loss or trailing stop loss that will trigger when an entry is triggered. You can also choose to use it as long or short only.
This indicator is automation ready with alerts for both opening and closing positions.
***IMPORTANT***
For access, please do not comment below. Instead, send a DM here on TradingView or on my linked Twitter account.
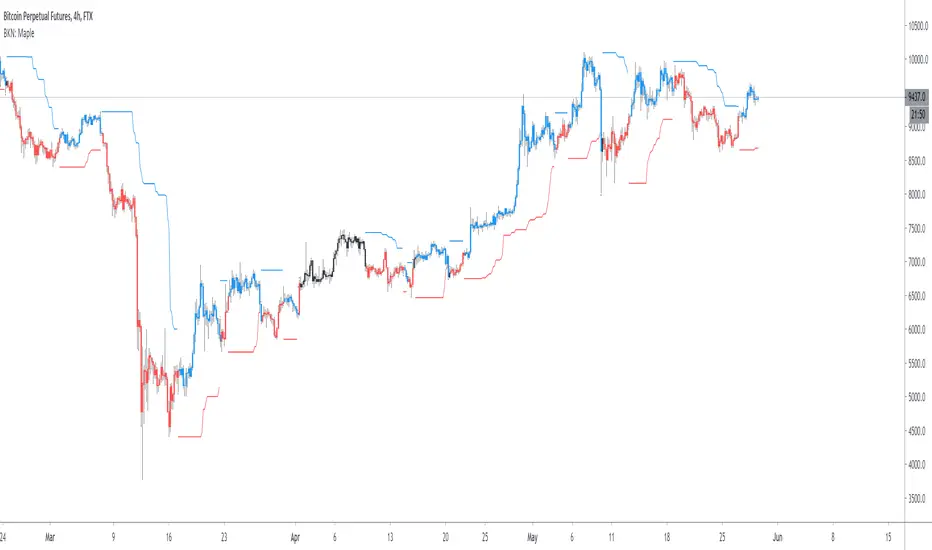
BKN: MapleThis strategy is tied to the BKN: Maple indicator which is an automation ready algo for entering/exiting trades. The script comes prepared with a stop loss and trailing stop loss so that you don't have to host your stop on the exchange and can also optimize trade entries and exits.
We've released optimizations for Forex and Crypto on multiple timeframes, but the script shines on the one and four hour charts.
***IMPORTANT***
For access, please do not comment below. Access requests in the comments will not be responded to.
Instead, please send a DM or reach out to my linked Twitter account.
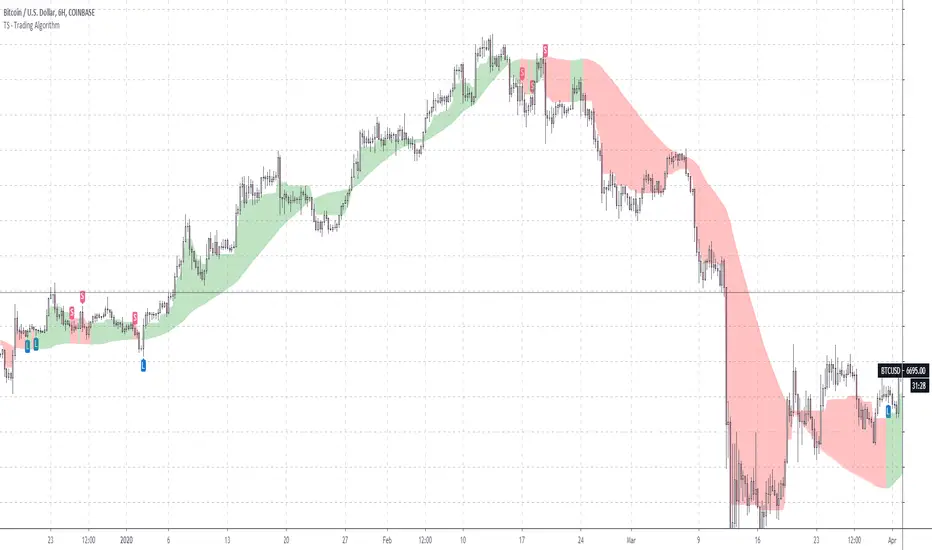
TS - Trading AlgorithmWhat is it?
The Tradespot MA Algo is an all in one, profitable moving average based trading strategy that presents long and short opportunities.
This indicator does not repaint. Once a bar has closed, the signal will remain permanently printed onto the chart.
What can I do with it?
Use on the following markets:
COINBASE:BTCUSD
COINBASE:ETHUSD
COINBASE:ETHBTC
Timeframe: 1D
What does each signal mean?
Long label is a strong buy signal
Short label is a strong sell signal
X's indicate a warning telling you that you should possibly exit your position. You should review these signals alongside other indicators such as volatility.
Review X signals?
Yes, there are concrete buys and sells but the X's indicate possible exits that might also be fakeouts, we can created the perfect indicator set up to review these with our TS - Trend Confirmation indicator and our TS - Volatility Screener indicator
How do I get access?
Please contact me on TradingView for details.
LuxAlgo® - Signals & Overlays™Signals & Overlays™ is an all-in-one toolkit made up of more than 20+ features primarily focused on generating useful signals & overlays to fulfill any trader's technical analysis needs with relevant data.
Created directly with TradingView Pine Script Wizard, alexgrover - this is a first of its kind comprehensive script made fully from the ground-up to provide an all-in-one solution for traders.
Signals & Overlays™ can be used alongside other forms of technical analysis, however, it was also designed to be used as a stand-alone toolkit that can fit any trading style. Every feature included considers how not all technical indicators fit every market condition.
The ideal way to utilize this indicator is to explore through all of the features over time, pick & choose 2-3 features best suit your style of trading, and stick with those to create your own unique LuxAlgo trading strategy.
Providing Endless Possibilities Catering To All Trading Styles
Signals & Overlays™ works in any market for discretionary analysis & includes many features:
Beginner-friendly Presets to enable multiple features at once within one-click (locks other settings when enabled).
Confirmation Signals: Normal & Strong signals to help traders confirm trends (not to be followed blindly).
Contrarian Signals: Normal & Strong to help traders spot reversals (also not to be followed blindly).
Exit Signals: "x" marks that apply for both Confirmation Signals & Contrarian Signals to suggest potential take-profit areas during signals.
Signal Optimization Methods: Sensitivity / Agility, optimal sensitvity parameter displayed on dashboard, and Autopilot (dynamic setting).
Candle Coloring: Purple/Green/Red to visualize trends developing between 'normal' & 'strong'.
6+ Indicator Overlays that helps traders visualize trends, find reversal points, and get dynamic areas of support & resistance.
Filters within "Presets / Filters" to allow users to filter Confirmation Signals with Indicator Overlays & other metrics within LuxAlgo Premium.
A complete dashboard with highly actionable metrics such as Trend Strength, current volatility, volume analysis, etc.
Advanced Settings to display customizable TP/SL points, further enhance signal optimizations, & customize dashboard size/location.
Full Any Alert() Function Call Conditions included
Highly useful Filtered Alert Creator section to generate custom filtered signal alerts with Indicator Overlays & other metrics.
+ more. (Check the changelog below for current features)
🔶 USAGE
Basic Signals & Candle Coloring Demonstration
In the image below we can see a basic example of how these 2 core components function within Signals & Overlays™.
As explained earlier, the Confirmation Signals can generate normal labels as well as strong labels marked by the "+" symbol. These signals are directly correlated to the candle coloring in order to see the development of trends & navigate through different market conditions as best as possible.
The candle coloring comes especially in handy when using signals, whereas a positive sign for an uptrend to occur rather than a fake-out is to see candles consistently hold as green. This indicates the market is strong & is likely to continue an uptrend. Vice versa for sell signals & the candles holding as red.
Normal Confirmation Signals often occur with smaller trends, retracements within larger trends, or just as signals a user may not want to trust as much directly. In order to enhance your ability to trust signals more & find more actionable use cases out of LuxAlgo Premium, we recommend going to the settings menu of the indicator & activating some indicator overlays. These are covered in the next section.
🔶 INDICATOR OVERLAYS W/ SIGNALS
In the image below we have enabled the "Smart Trail" & "Reversal Zones" indicator overlays from within the settings of Signals & Overlays™. By using these overlays alongside the signals & candle coloring, users can find more confluence to create trading strategies or plans.
The Smart Trail provides an excellent area of dynamic support/resistance for traders, as well as an additional confluence for general trend following purposes alongside the Confirmation Signals.
The Reversal Zones are particularly useful for areas to immediately take profit on trades, however, during strong trends price may continue rising or falling through the Reversal Zones which makes a good use case of waiting for price to first exit the Reversal Zones before considering the next move in the market.
In the next image below we can see the market is generally ranging, making it more complicated for the standard Confirmation signals to perform greatly as they are meant to excel for finding developing trends. This image displays the Contrarian Signal Mode, Contrarian Gradient candle coloring, as well as the Trend Catcher Indicator Overlay to help us trade these market conditions specifically.
Paired with the Contrarian based candle coloring, these signals can be helpful to a trader looking to find confluent reversals. You can also see the Trend Catcher indicator overlay gives a hybrid approach to analyzing the underlying trend within this price action.
Some traders naturally are Contrarian in nature, so this signal mode may be of primary interest to them, however, most of the use cases will come from the standard Confirmation sigals paired with other overlays or regular technical analysis.
🔶 SIGNALS WITH AI CLASSIFICATION
Our toolkit is able to classify generated signals using a simple machine learning algorithm into four levels. These levels indicate if a signal will most likely indicate a trend continuation (level 3/4) or a reversal/retracement (1/2).
Users are able to filter out certain signals depending on their classification, only keeping signals of interest and potential filtering out false signals.
🔶 FILTERS
In the next image below we can see after resetting the Signals & Overlays™ indicator to it's defaults, we have simply enabled the "Smart Trail Filter" from within the Presets / Filters section at the top of the settings.
By doing this, we can filter out signals that are not aligned with the Smart Trail indicator overlay, which gives direct confluence in every signal that generates on the chart.
Applying filters to signals do not necessarily make them instantly "better" than using the indicator without them. Between every technical indicator, there are trade-offs. So while we can now use Confirmation signals & retests of the Smart Trail as great optimal entry points, at times the indicator may miss signals or retests of the Smart Trail.
The same is seen below with another one of the Filters within Signals & Overlays™; Trend Strength Filter.
We can see the indicator is using the Trend Strength metric to only generate Confirmation Signals that align with a trending market which can clean up a lot of noise during retracements as well as ranging markets.
However, the trade-off present now with this filter enabled is that at times the indicator will miss trends, in which we'd still need to be aware of the price action, candle coloring, or other forms of analysis to give us indications the market may start a new trend opposed to just relying on signals directly.
🔶 CONCLUSION
We believe that success lies in the association of the user with the indicator, opposed to many traders who have the perspective that the indicator itself can make them become profitable. The reality is much more complicated than that.
The aim is to provide an indicator comprehensive, customizable, and intuitive enough that any trader can be led to understand this truth and develop an actionable perspective of technical indicators as support tools for decision making.
You can see the Author's instructions below to get instant access to this indicator & our LuxAlgo Premium indicator suite.
🔶 RISK DISCLAIMER
Trading is risky & most day traders lose money. All content, tools, scripts, articles, & education provided by LuxAlgo are purely for informational & educational purposes only. Past performance does not guarantee future results.

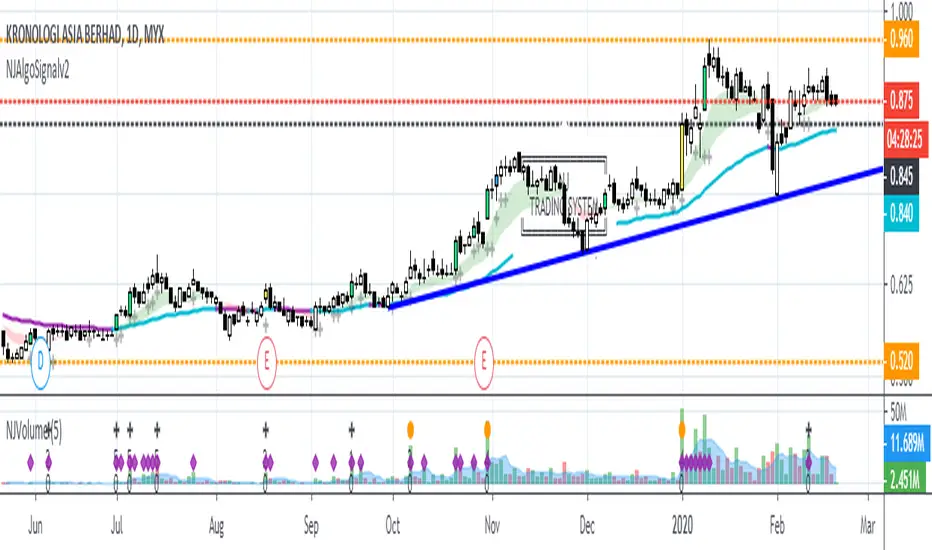
NJAlgoSignalv2NJ-ALGO-SIGNAL
Combination of Price Breakout with Volume
Bar Color
Yellow = Breakout with Volume and Trend Change
Lime = Breakout with Volume
Blue = Breakout without Volume
Black Line = Trailing Stop Line
Sell when price break the Stop Loss Line.
Try to entry on Yellow and Lime Candle.
Can consider to exit when Blue Candle occur. Sign of weakness on uptrend.
Label
Shows only when bar color condition meet
Calculate risk level based on the current price and trailing stop loss line (Black Line).
52W High
By default is off.
Background Color
To Indicate Bullish or Bearish zone.
Green = Bullish zone
Red = Bearish zone
CryptoEngineering 🔥Isn’t It Time You Made Your Crypto Portfolio Great Again? 🔥
The falling knives, the heartbreaking crashes, the devastating feeling of watching a missed trade soar all the way to the moon.
The markets aren’t fair, which means you need a tool that gives you an edge. So,It is time to try EngineeringRobo.
The Engineeringrobo is a great ally in a crypto market - when the price moves the algorithm will automatically show Buy and Sell orders when there is a best opportunity to make a profit. It is a just SMART trading system script on TradingView that brings the easiest approach to trading with a high profitability rate.
I created EngineeringRobo to help you on your traders as a robo advisor , It will "not " trade on behalf of you on exchanges via API. It is not an AI robot,It is am ALGO Trading robot. You can use it on any trading markets (BIST, S&P 500,Commodities ,Forex, Crypto ) with any time frame!
My unique algorithm find profitable altcoins based on their Ichimoku, McGinley, MA, RSI, MACD, Stochastic, Volumes and Price Changes gives you BUY and SELL signals. The EngineeringRobo indicator displays two different signals for entry and exit on a coin to maximize its profitability on the chart. The signals can appear at any time during an open candle, but once closed the signal is final and wont change in the future.
One of the biggest advantages of algo trading is removing human emotion from the crypto markets,humans trading are susceptible to emotions that lead to irrational decisions.Robo doesn't have to think or feel good to make a trade. If conditions are met, it enters.When the trade goes the wrong way or hits a profit target, It exits. It doesn't get angry at the market or feel invincible after making a few good trades. The two emotions that lead to poor decisions that algo traders aren't susceptible to are fear,and greed.
That's why It makes money but most of you not!
What Are the Advantages of using it as a ROBO Advisor?
🔴Reduce your required screen-time
🔴Reduce anxiety over missing setups when you are busy
🔴Turn existing indicators into alerts (eg. Whenever RSI goes overbought)
🔴Find comfort in knowing that you have me on your side
To get the maximized results from @EngineeringRobo
Open tradingview
Decide the coin/BTC
Pick 1M
Draw the Support & Resistance lines
Change the 1W
Draw the lines - Support & Resistance
Find out Chart Patterns
Change to 3D/1D / 3H
Check Robo' signals
Set your orders
Enjoy your profits💰
***Even the best automated day trading software can trigger false trends.
In August 2012 by Knight Capital group;who lost over $440 million in just half an hour when their trading software went rogue in response to market conditions. That's why it is a Robo advisor not trading bot! Engineeringrobo is not a get-rich-quick scheme as well!
Disclaimer
Information on EngineeringRobo should not be seen as a recommendation to trade BIST, S&P 500,Commodities ,Forex, Crypto.
EngineeringRobo is not licensed nor authorized to provide advice on investing and related matters.
Information on the page is not, nor should it be seen as investment advice.Any trading decisions that you make are solely your responsibility. Clients without sufficient knowledge should seek individual advice from an authorized source.
Crypto and Forex trading entails significant risks and there is a chance that clients lose all of their invested money. Past performance is not a guarantee of future returns. Before trading with any of the Algos, clients should make sure they understand the risks.
EngineeringRobo nor its agents or partners are not registered and do not provide any services on the US territory.
***I have been trading since 2016 . Got my first bitcoin in 2013

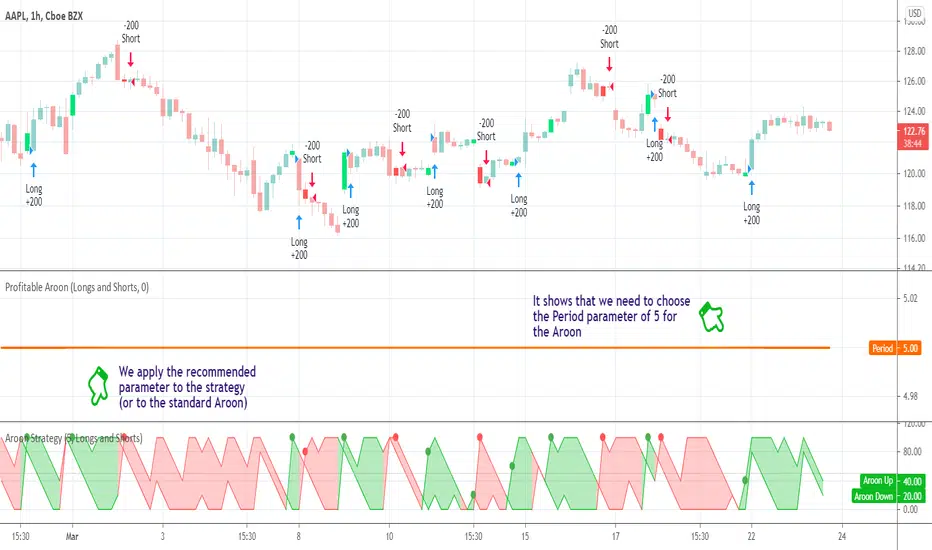
Profitable AroonIntroduction
The Aroon indicator was developed by well-known technical analyst Tushar Chande in 1995 and is used to identify trend changes in the price of an asset, as well as the strength of that trend. The fact that he named the indicator "Aroon" which is Sanskrit for "Dawn’s Early Light" demonstrates his belief in his indicator's trend discovery capabilities.
It is composed of two lines, Aroon Up and Aroon Down .
The most basic strategy is to use the crossovers as trade signals:
when Aroon Up crosses above Aroon Down , go Long
when Aroon Down crosses above Aroon Up , go Short
Exit when a crossover occurs in the opposite direction
What is this tool?
This tool is a performance scanner that uses a decision tree-based algorithm under the hood to find the most profitable period setting for the Aroon. It analyzes the range of periods between 2 to 100 and backtests the Aroon indicator for each period using the strategy mentioned above across the entire history of an instrument. If a more profitable parameter was found, the indicator will switch its value to the found one immediately.
Alerts
It has an alert that notifies when a more profitable period was found.
NOTE : It does not change what has already been plotted.
Good luck and Happy Trading!
Trend Precognition - Mtrl_Scientist (arrow-only)Hey everybody,
Per request, I'm also adding the arrow-version to the updated base algorithm.
However, I advise everyone to also add the indicator version that I published previously.

Trend Precognition - Mtrl_ScientistHi everyone,
This is an updated version of my base algorithm "BTC Precognition". I've managed to remove some lag, while at the same time smoothing the curve (blue).
All you need to know about it is on the chart's legend. The arrows just correspond to the bottoms/tops of the blue signal curve (marked with green/red circles). However, predicting turning points is difficult and I'm still working on that. So for now, the signals are offset by 1 candle into the past. This means that all of your trades will be 1 candle late, unless you trade intrabar using your own intuition. As a help, I've also included the first derivative (black curve) that will tell you the slope of the blue curve. Remember, when the curve is about to turn, the slope becomes zero. However, you can anticipate this by looking at the slope's direction and guessing when it will cross the zero line.
This is still all work in progress, so invite-only.

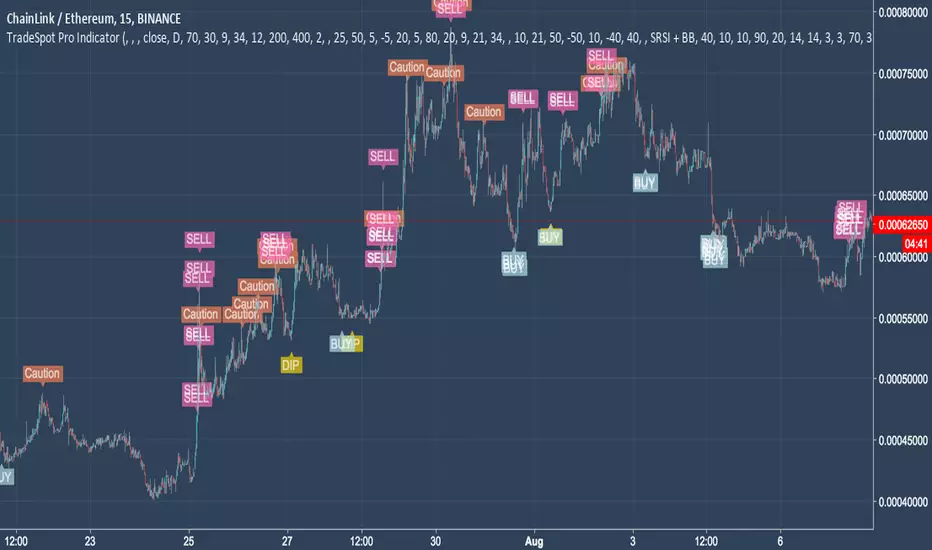
TradeSpot Pro || All Purpose Advanced Trading Indicator & AlertsTradeSpot Pro Indicator
Version: 1.0
TradeSpot Community Website
TradeSpot is a community of traders that specialise in using automated bots to execute spot & margin trading, you can join up via the above link where you too can discuss cryptocurrency, general trading, investments and get informed on the latest botting tools to enhance your day to day trading.
For an in-depth explanation and briefing on what this indicator is capable of, please contact me directly.
Features
Inclusion of all 4 highly regarded indicators previously used by the indicator and combined into one cross-functional powerhouse script sporting different strategies eg. EMA, RMI, RSI, BB based signals (and more!
Neat presentable UI for easily displaying the quality of your current settings.
Incredible customisation, one of the most heavily parameterised scripts on TradingView - this is not a plug and play solution but rather a script you can learn and tweak to really fine tune your strategy, ultimately improving results.
Big list of features listed on the community Discord server that will be developed and added to the indictor in good time (and a backtesting script!).
Combine indicators, a heavily asked for feature finally here - being able to match the signals between included indicators to create an even more robust trading signal.
Scripted with a full array of custom and alerts and more coming for use in manual trading endeavours to never miss a trade or for use with automated bot solutions that can be seen on the community site.
Access
Discord Server
For trial access please follow the link the server above and use the '!trial' command on the chat channel. If you don't use Discord please private message me on here.
Fibonacci Algo - LongAutomatic Fibonacci retracement entry, stop loss and extension target level as apart of a customisable strategy.
Automatic plots of 23.6% 38.2%, 50%, 61.8%, 65%, 78.6% and -23.6, -61.8% and -100% levels.
Customisable Fib Length - Time period over which max and min pivots are chosen.
Customisable Offsetfib - Offsets the pivots and sell zone as your entry position
will be some time after the upper and lower pivots are set.
Vegas Wave - Automatic plot. Shows price relative to wave and EMA crossover - See my 'Vegas Wave' code for more of an explanation.
A strategy based off buying the 50-618 with a defined stop loss the other side of the 65 or 786 can easily be formulated.
This tool will automatically plot those points but a defined Risk Management strategy will always be needed.
The 236 and 382 region can also be plotted, allowing for lesser retracements coinciding with wave 4 pullbacks ( Elliott Wave Traders).
Works best in Bullish trends but will work on all timeframes (Bullish correction in an downtrend also possible).
Previous pivots shown but be careful to identify which of the several pivots you are using.
Start at a larger timeframe and move down. (Entries consistent on several timeframes are golden)
Pivots and retracements are dynamic. Be sure to note your entry and targets.
Works well when used in combination with an oscillator which highlights Divergence.
Also refer to my other 'Fibonacci' Codes for more context.
