Volume Delta Candles HTF [TradingFinder] LTF Volume Candles 🔵 Introduction
In financial markets, understanding the concepts of supply and demand and their impact on price movements is of paramount importance. Supply and demand, as fundamental pillars of economics, reflect the interaction between buyers and sellers.
When buyers' strength surpasses that of sellers, demand increases, and prices tend to rise. Conversely, when sellers dominate buyers, supply overtakes demand, causing prices to drop. These interactions play a crucial role in determining market trends, price reversal points, and trading decisions.
Volume Delta Candles offer traders a practical way to visualize trading activity within each candlestick. By integrating data from lower timeframes or live market feeds, these candles eliminate the need for standalone volume indicators.
They present the proportions of buying and selling volume as intuitive colored bars, making it easier to interpret market dynamics at a glance. Additionally, they encapsulate critical metrics like peak delta, lowest delta, and net delta, allowing traders to grasp the market's internal order flow with greater precision.
In financial markets, grasping the interplay between supply and demand and its influence on price movements is crucial for successful trading. These fundamental economic forces reflect the ongoing balance between buyers and sellers in the market.
When buyers exert greater strength than sellers, demand dominates, driving prices upward. Conversely, when sellers take control, supply surpasses demand, and prices decline. Understanding these dynamics is essential for identifying market trends, pinpointing reversal points, and making informed trading decisions.
Volume Delta Candles provide an innovative method for evaluating trading activity within individual candlesticks, offering a simplified view without relying on separate volume indicators. By leveraging lower timeframe or real-time data, this tool visualizes the distribution of buying and selling volumes within a candle through color-coded bars.
This visual representation enables traders to quickly assess market sentiment and understand the forces driving price action. Buyer and seller strength is a critical concept that focuses on the ratio of buying to selling volumes. This ratio not only provides insights into the market's current state but also serves as a leading indicator for detecting potential shifts in trends.
Traders often rely on volume analysis to identify significant supply and demand zones, guiding their entry and exit strategies. Delta Candles translate these complex metrics, such as Maximum Delta, Minimum Delta, and Final Delta, into an easy-to-read visual format using Japanese candlestick structures, making them an invaluable resource for analyzing order flows and market momentum.
By merging the principles of supply and demand with comprehensive volume analysis, tools like the indicator introduced here offer unparalleled clarity into market behavior. This indicator calculates the relative strength of supply and demand for each candlestick by analyzing the ratio of buyers to sellers.
🔵 How to Use
The presented indicator is a powerful tool for analyzing supply and demand strength in financial markets. It helps traders identify the strengths and weaknesses of buyers and sellers and utilize this information for better decision-making.
🟣 Analyzing the Highest Volume Trades on Candles
A unique feature of this indicator is the visualization of price levels with the highest trade volume for each candlestick. These levels are marked as black lines on the candles, indicating prices where most trades occurred. This information is invaluable for identifying key supply and demand zones, which often act as support or resistance levels.
🟣 Trend Confirmation
The indicator enables traders to confirm bullish or bearish trends by observing changes in buyer and seller strength. When buyer strength increases and demand surpasses supply, the likelihood of a bullish trend continuation grows. Conversely, decreasing buyer strength and increasing seller strength may signal a potential bearish trend reversal.
🟣 Adjusting Timeframes and Calculation Methods
Users can customize the indicator's candlestick timeframe to align with their trading strategy. Additionally, they can switch between moving average and current candle modes to achieve more precise market analysis.
This indicator, with its accurate and visual data display, is a practical and reliable tool for market analysts and traders. Using it can help traders make better decisions and identify optimal entry and exit points.
🔵 Settings
Lower Time Frame Volume : This setting determines which timeframe the indicator should use to identify the price levels with the highest trade volume. These levels, displayed as black lines on the candlesticks, indicate prices where the most trades occurred.
It is recommended that users align this timeframe with their primary chart’s timeframe.
As a general rule :
If the main chart’s timeframe is low (e.g., 1-minute or 5-minute), it is better to keep this setting at a similarly low timeframe.
As the main chart’s timeframe increases (e.g., daily or weekly), it is advisable to set this parameter to a higher timeframe for more aligned data analysis.
Cumulative Mode :
Current Candle : Strength is calculated only for the current candlestick.
EMA (Exponential Moving Average) : The strength is calculated using an exponential moving average, suitable for identifying longer-term trends.
Calculation Period : The default period for the exponential moving average (EMA) is set to 21. Users can modify this value for more precise analysis based on their specific requirements.
Ultra Data : This option enables users to view more detailed data from various market sources, such as Forex, Crypto, or Stocks. When activated, the indicator aggregates and displays volume data from multiple sources.
🟣 Table Settings
Show Info Table : This option determines whether the information table is displayed on the chart. When enabled, the table appears in a corner of the chart and provides details about the strength of buyers and sellers.
Table Size : Users can adjust the size of the text within the table to improve readability.
Table Position : This setting defines the table’s placement on the chart.
🔵 Conclusion
The indicator introduced in this article is designed as an advanced tool for analyzing supply and demand dynamics in financial markets. By leveraging buyer and seller strength ratios and visually highlighting price levels with the highest trade volume, it aids traders in identifying key market zones.
Key features, such as adjustable analysis timeframes, customizable calculation methods, and precise volume data display, allow users to tailor their analyses to market conditions.
This indicator is invaluable for analyzing support and resistance levels derived from trade volumes, enabling traders to make more accurate decisions about entering or exiting trades.
By utilizing real market data and displaying the highest trade volume lines directly on the chart, it provides a precise perspective on market behavior. These features make it suitable for both novice and professional traders aiming to enhance their analysis and trading strategies.
With this indicator, traders can gain a better understanding of supply and demand dynamics and operate more intelligently in financial markets. By combining volume data with visual analysis, this tool provides a solid foundation for effective decision-making and improved trading performance. Choosing this indicator is a significant step toward refining analysis and achieving success in complex financial markets.
Linha de Avanço/Declínio de Volume

Cryptocurrency SentimentOverview
This script focuses on calculating and visualizing the sentiment difference between LONG positions and SHORT positions for a selected cryptocurrency pair on the Bitfinex exchange. It provides a clean and clear visual representation of the sentiment, helping traders analyze market behavior.
Key Features
Dynamic Symbol Selection:
The script automatically detects the cryptocurrency symbol from the chart (syminfo.basecurrency) and dynamically constructs the LONGS and SHORTS ticker symbols.
Works seamlessly for pairs like BTCUSD, ETHUSD, and others available on Bitfinex.
Sentiment Calculation:
The sentiment difference is calculated as:
Sentiment Difference=−1×(100− SHORTS/LONGS ×100)
LONGS : The total number of long positions.
SHORTS : The total number of short positions.
If SHORTS is 0, the value is safely skipped to avoid division errors.
Color Coding:
The script visually highlights the sentiment difference:
Green Line: Indicates that LONG positions are dominant (bullish sentiment).
Red Line: Indicates that SHORT positions are dominant (bearish sentiment).
Zero Reference Line:
A gray horizontal line at 0 helps users quickly identify the transition between bullish (above zero) and bearish (below zero) sentiment.
How It Works
Fetching Data:
The script uses request.security to fetch LONGS and SHORTS data at the current chart timeframe (timeframe.period) for the dynamically generated Bitfinex tickers.
Handling Data:
Missing or invalid data (NaN) is filtered out to prevent errors.
Extreme spikes or irregular values are safely avoided.
Visualization:
The sentiment difference is plotted with dynamic color coding:
Green when LONGS > SHORTS (bullish sentiment).
Red when SHORTS > LONGS (bearish sentiment).
Benefits
Market Sentiment Insight: Helps traders quickly identify if the market is leaning towards bullish or bearish sentiment based on actual LONG and SHORT position data.
Dynamic and Adaptive: Automatically adjusts to the selected cryptocurrency symbol on the chart.
Clean Visualization: Focuses solely on sentiment difference with color-coded signals, making it easy to interpret.
Best Use Cases
Trend Confirmation: Use the sentiment difference to confirm trends during bullish or bearish moves.
Market Reversals: Identify potential reversals when sentiment shifts from positive (green) to negative (red) or vice versa.
Sentiment Monitoring: Monitor the overall market bias for cryptocurrencies like BTC, ETH, XRP, etc., in real-time.
Sample Chart Output
Above Zero → Green Line: Bullish sentiment dominates.
Below Zero → Red Line: Bearish sentiment dominates.
Zero Line → Transition point for shifts in sentiment.

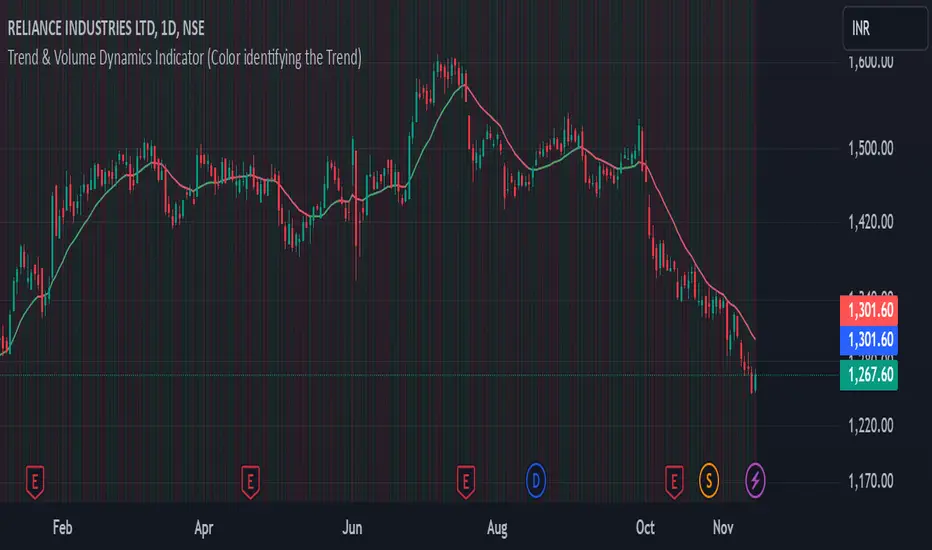
Trend & Volume Dynamics Indicator (Color identifying the Trend)Benefits
1. Trend Identification:
o The script calculates a 20-period Weighted Moving Average (WMA) of the closing prices. This helps in smoothing out price data to identify the underlying trend.
o The color of the WMA line changes based on the price position relative to the WMA:
Green: When the current price is above the WMA, indicating a potential uptrend.
Red: When the current price is below the WMA, indicating a potential downtrend.
Blue: When the price is exactly at the WMA, indicating no clear trend.
2. Volume Dynamics:
o The script also plots the volume with a color-coding mechanism:
Green: When the current volume is higher than the previous period's volume, indicating increasing trading activity.
Red: When the current volume is lower than the previous period's volume, indicating decreasing trading activity.
o The volume bars are plotted with 90% transparency, making them less visually dominant but still informative.
Usage
• Overlay: The indicator is set to overlay=true, meaning it will be plotted directly on the price chart, allowing users to see the WMA and volume dynamics in the context of the price movements.
• WMA Length: The length of the WMA is set to 20 periods, which is a common setting for short to medium-term trend analysis.
• Visual Cues: The color changes in both the WMA and volume bars provide immediate visual cues about the trend and volume dynamics, helping traders make quicker decisions.
Detailed Explanation of the Script
1. Indicator Declaration:
o Declares the indicator with a descriptive name and specifies that it should be overlaid on the price chart.
2. WMA Calculation:
o Defines the length of the WMA and calculates it using the closing prices.
3. Plotting the WMA:
o Plots the WMA with full brightness (0 transparency).
4. Color-Coding the WMA:
o Changes the color of the WMA line based on the price's position relative to the WMA.
5. Volume Indicator:
o Plots the volume bars with color-coding based on the volume change from the previous period and with 90% transparency.
Conclusion
One of the most best combinations of Volume and Moving average and works on any given timeframe and charts
Jackson Volume breaker Indication# Jackson Volume Breaker Beta
### Advanced Volume Analysis Indicator
## Description
The Jackson Volume Breaker Beta is a sophisticated volume analysis tool that helps traders identify buying and selling pressure by analyzing price action and volume distribution. This indicator separates and visualizes buying and selling volume based on where the price closes within each candle's range, providing clear insights into market participation and potential trend strength.
## Key Features
1. **Smart Volume Distribution**
- Automatically separates buying and selling volume
- Color-coded volume bars (Green for buying, Red for selling)
- Winning volume always displayed on top for quick visual reference
2. **Real-time Volume Analysis**
- Shows current candle's buy/sell ratio
- Displays total volume with smart number formatting (K, M, B)
- Percentage-based volume distribution
3. **Technical Overlays**
- 20-period Volume Moving Average
- Dynamic scaling relative to price action
- Clean, uncluttered visual design
## How to Use
### Installation
1. Add the indicator to your chart
2. Adjust the Volume Scale input based on your preference (default: 0.08)
3. Toggle the Moving Average display if desired
### Reading the Indicator
#### Volume Bars
- **Green Bars**: Represent buying volume
- **Red Bars**: Represent selling volume
- **Stacking**: The larger volume (winning side) is always displayed on top
- **Height**: Relative to the actual volume, scaled for chart visibility
#### Information Table
The top-right table shows three key pieces of information:
1. **Left Percentage**: Winning side's volume percentage
2. **Middle Percentage**: Losing side's volume percentage
3. **Right Number**: Total volume (abbreviated)
### Trading Applications
1. **Trend Confirmation**
- Strong buying volume in uptrends confirms bullish pressure
- High selling volume in downtrends confirms bearish pressure
- Volume divergence from price can signal potential reversals
2. **Support/Resistance Breaks**
- High volume on breakouts suggests stronger moves
- Low volume on breaks might indicate false breakouts
- Monitor volume distribution for break direction confirmation
3. **Reversal Identification**
- Volume shift from selling to buying can signal potential bottoms
- Shift from buying to selling can indicate potential tops
- Use with price action for better entry/exit points
## Input Parameters
1. **Volume Scale (0.01 to 1.0)**
- Controls the height of volume bars
- Default: 0.08
- Adjust based on your chart size and preference
2. **Show MA (True/False)**
- Toggles 20-period volume moving average
- Useful for identifying volume trends
- Default: True
3. **MA Length (1+)**
- Changes the moving average period
- Default: 20
- Higher values for longer-term volume trends
## Best Practices
1. **Multiple Timeframe Analysis**
- Compare volume patterns across different timeframes
- Look for volume convergence/divergence
- Use higher timeframes for major trend confirmation
2. **Combine with Other Indicators**
- Price action patterns
- Support/resistance levels
- Momentum indicators
- Trend indicators
3. **Volume Pattern Recognition**
- Monitor for unusual volume spikes
- Watch for volume climax patterns
- Identify volume dry-ups
## Tips for Optimization
1. Adjust the Volume Scale based on your chart size
2. Use smaller timeframes for detailed volume analysis
3. Compare current volume bars to historical patterns
4. Watch for volume/price divergences
5. Monitor volume distribution changes near key price levels
## Note
This indicator works best when combined with proper price action analysis and risk management strategies. It should not be used as a standalone trading system but rather as part of a comprehensive trading approach.
## Version History
- Beta Release: Initial public version
- Features buy/sell volume separation, moving average, and real-time analysis
- Optimized for both intraday and swing trading timeframes
## Credits
Developed by Jackson based on other script creators
Special thanks to the trading community for feedback and suggestions

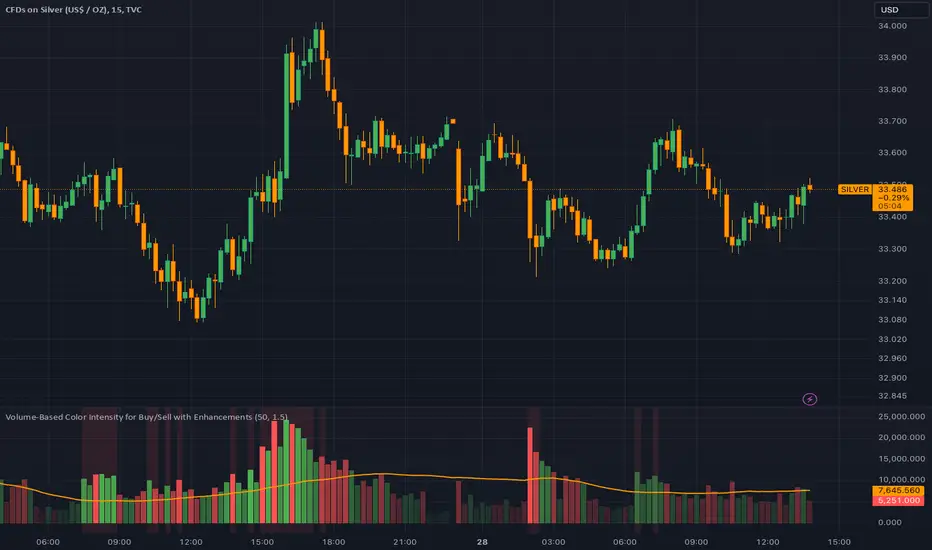
Dynamic Volume-Based Buy/Sell IndicatorThis script provides a powerful volume-based indicator that visualizes buy and sell volumes, issues alerts for volume spikes, and adjusts color intensity dynamically based on volume size. It includes customizable settings for volume averaging and thresholds, making it adaptable to various trading strategies.
TechniTrend: Relative Volume IndexRelative Volume Index (RVI)
Short Description:
Relative Volume Index (RVI) with customizable volume bands, moving averages, and alerts for high and low volume thresholds. Includes options for displaying daily and weekly relative volume for enhanced analysis.
Full Description:
The Relative Volume Index is a powerful and versatile tool designed to help traders easily identify volume trends and anomalies in the market. By comparing the current volume to its moving average, this indicator highlights significant increases or decreases in relative volume, allowing traders to catch potential breakouts, breakdowns, or volume spikes early on.
Key Features:
Relative Volume Comparison : Compares the current volume to the moving average volume over a customizable period, highlighting overbought and oversold conditions.
Volume Alerts : Customizable alert thresholds for high and low relative volume to quickly notify traders when volume exceeds predefined limits.
Custom Moving Averages : Choose from various moving average types (SMA, EMA, WMA) to calculate the average volume over a given length.
Volume Normalization : For better readability, volumes greater than 1000 are divided by 1000 and displayed with a 'K' suffix (thousands).
Volume Bands : Configurable high, average, and low volume bands for visual reference.
Daily Relative Volume : Option to display the daily relative volume in comparison to its daily average.
Weekly Average Volume : Option to display the weekly average volume for broader market trends.
Customization Options:
Length : Customize the period for calculating the moving average.
Volume Moving Average : Toggle to show/hide the volume moving average (normalized in 'K').
Alerts : Set thresholds for high and low volume alerts and configure alerts for immediate notification.
Volume Bands : Toggle to show/hide volume bands for easy visual identification of volume zones.
Daily/Weekly Relative Volume : Optional display of relative volume data on a daily and weekly basis.
This indicator provides traders with a more intuitive view of market volume dynamics, making it easier to spot significant volume changes and take action accordingly.
Recommended Settings:
High Volume Alert Threshold: 2.0
Low Volume Alert Threshold: 0.5
Length for Moving Average Calculation: 14
Show Weekly Average Volume: On for broader trend insights
Use this indicator to stay ahead of market moves by monitoring volume trends with precision.
Alerts:
High Volume Alert : Get notified when relative volume exceeds your high threshold.
Low Volume Alert : Get notified when relative volume drops below your low threshold.

Volume Insignts AnalyzerDescription:
The Volume Insight Analyzer is an advanced Pine Script designed for traders who want a comprehensive view of volume dynamics on their charts. This script combines multiple volume-based indicators to help identify key trading opportunities, including significant volume days, volume dry-ups, and pocket pivots.
Key Features:
VDU (Volume Dry-Up) Detection: Automatically identifies and marks days when the volume is significantly below its moving average, helping to spot potential breakout or breakdown points. Customizable volume thresholds allow for tailored analysis based on your trading strategy. The Volume Dry-Up label appears when the volume is substantially below its average level and the price is near a key moving average. This condition indicates a period of equilibrium between supply and demand, suggesting a potential low-risk entry point for traders.
Pocket Pivot Analysis using 5 and 10 Length Pocket Pivots: Highlights days with exceptionally high volume compared to recent history, indicating potential pocket pivots. Visual markers on the chart and volume bars color-coded for 5 and 10-day lengths. Pocket pivot points are identified when the volume on a given day exceeds the maximum volume observed over the past several days. Specifically, a 5-day pocket pivot point is marked when today's volume surpasses the highest selling volume of the last 5 days. A cluster of 5-day pocket pivot points within a base is a strong indicator of stock strength. Similarly, a 10-day pocket pivot point following a Volume Dry-Up (VDU) suggests a potential entry opportunity. Moreover, a pre-existing cluster of 5-day pocket pivot points before a 10-day pocket pivot point provides greater conviction in the trade.
Volume Moving Averages: Set different lengths for primary and secondary moving averages to track volume trends over daily, weekly, and monthly timeframes. Options to display moving average lines on the volume chart.
Volume Visualization:
a. Major and Minor Volume Bars: Option to display bars that are either above or below average volume levels. Adjustable settings to show or hide these bars based on user preference.
b. Volume Bar Coloring: Volume bars are color-coded based on significant volume thresholds, including green for bullish signals, red for bearish signals, and orange for volume dry-ups.
Volume Metrics Table: A customizable table that displays real-time volume metrics including Relative Volume (RVOL), Turnover, and the number of high volume days. The table can be oriented horizontally or vertically and styled according to your theme preferences.
Visual Indicators:
a) Volume Dry-Up (VDU) Labels: Clearly marked VDU events with textual annotations on the chart.
b) Bullish and Bearish Arrows: Arrows indicating potential bullish or bearish closes based on volume analysis, enhancing decision-making.
Customization Options:
a) Dark and Light Theme Support: Toggle between dark and light themes to match your chart settings.
b) Adjustable Parameters: Easily configure input settings such as volume thresholds, MA lengths, and table display options to fit your trading style.
How to Use:
Set Parameters: Adjust the script settings such as volume thresholds, moving average lengths, and display preferences according to your analysis needs.
Analyze Volume Patterns: Use the indicators and visual markers provided by the script to identify significant volume patterns and potential trading signals.
Monitor Metrics: Refer to the volume metrics table for a quick overview of key volume-related statistics and trends.
Make Informed Decisions: Utilize the visual cues and volume data provided by the script to enhance your trading strategy and make more informed decisions.
Disclaimer:
This script is for informational purposes only and should not be considered as trading advice. Use it in conjunction with other analysis tools and consult with a financial advisor if needed. Trading involves risk, and past performance does not guarantee future results.

ADI Market Internals MatrixUsage
This script is designed for use during market hours but is particularly useful in the last trading hour—a period known for increased volatility and volume as traders close positions and make final decisions for the day.
Trend Analysis
The histogram provides a quick visual reference for the market's direction based on USI:ADD and $VOLSPD. A predominance of green bars suggests a bullish trend, while red bars indicate bearish conditions based on the BIAS EMA.
Volatility Assessment
The VIX label gives a quick glance at the user-inputted VIX pivot, aiding in volatility assessment and bias determination.
Features
VIX Label: Changes color (red/green) to indicate a bullish or bearish bias based on the user's input for the VIX pivot.
EMA Calculations: Calculates the EMAs for USI:ADD and $VOLSPD based on custom input, which helps determine the market trend.
Trend Determination: Identifies the close value of USI:ADD and $VOLSPD and whether they are above or below their respective EMAs.
Loopback Period: Calculates how far to look back to determine the trend, adjustable by the user.
Market Hours Control: Includes an input (startTime) for specifying when the histogram should start and end (9:30 AM to 4:00 PM EST).
Histogram Coloring
Green: Indicates a bullish trend (above the specified EMA length).
Red: Indicates a bearish trend (below the specified EMA length).
Gray: Indicates a neutral trend.
Customization
Users can adjust the script's sensitivity by changing the length for the EMAs, vixThreshold, startTime, and loopbackPeriod to fit their trading style or market conditions.
Note
Always use this tool in conjunction with other technical analysis tools and ensure proper risk management strategies are employed.

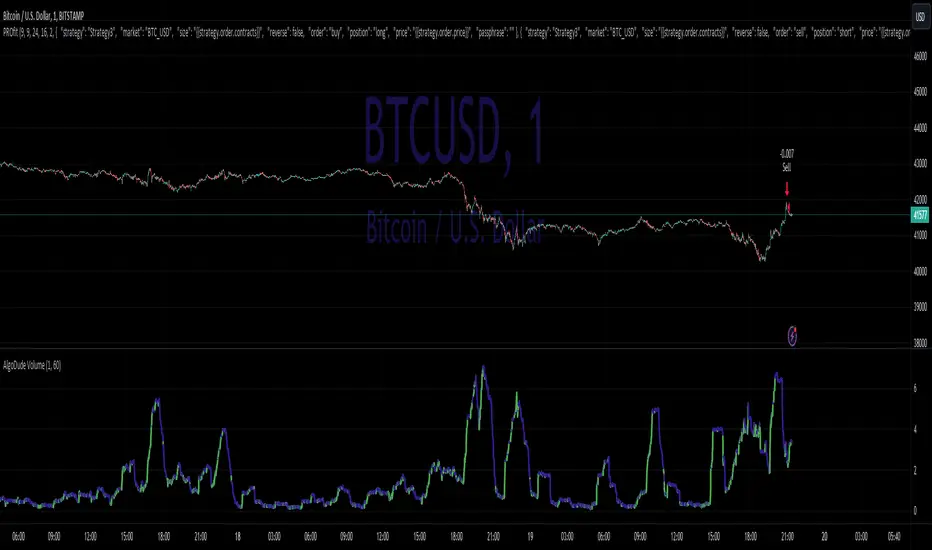
AlgoDude_Volume1. Timeframe Selection (selectedTimeframe):
Allows the user to choose the timeframe for the volume data analysis.
Options range from 1 minute to 1 month, including 1, 3, 5, 15, 30, 45 minutes, 1, 2, 3, 4 hours, and daily, weekly, monthly.
2.Moving Average Length (maLength):
Users can specify the length of the moving average applied to the inverse volume.
The range for this input is from 1 to 200 periods, with a default value of 14.
These inputs provide flexibility in analyzing volume data over various timeframes and smoothing the inverse volume data with a moving average of chosen length.
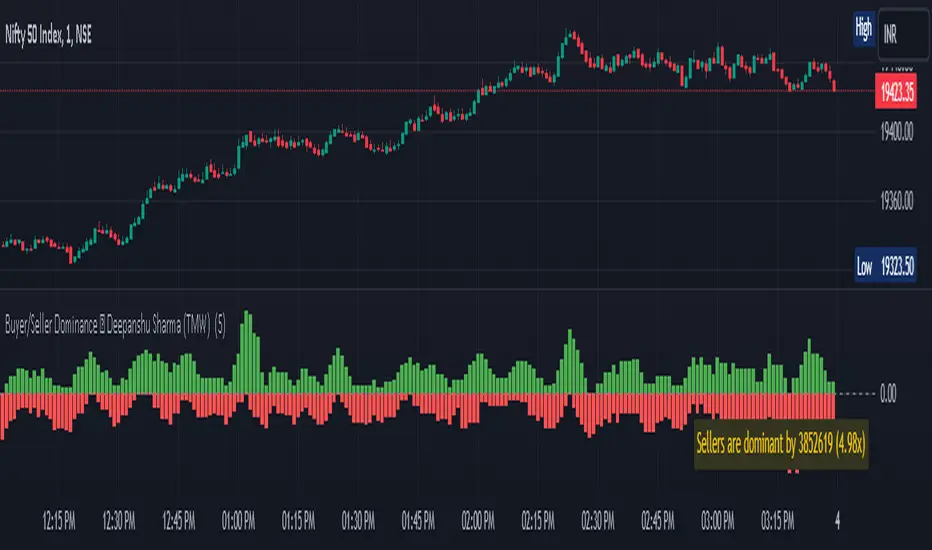
Buyer/Seller Dominance ©TMW
The "Buyer/Seller Dominance" indicator script, developed by Deepanshu Sharma under The Market Wisdom (TMW), is a powerful analytical tool designed for use on the TradingView platform. This script is released under the Mozilla Public License 2.0, and it offers traders and investors an innovative perspective on market dynamics by assessing the relative strength of buyers and sellers within a given time frame.
Key Features:
1. Dominance Calculation: The indicator calculates the dominance of buyers and sellers over a specified number of candles. Users can define the number of candles (`n`) to consider in the dominance calculation.
2. Visual Representation: The script provides a visual representation of buyer and seller dominance using colored columns on the price chart. Green columns represent buyer dominance, while red columns represent seller dominance.
3. Balance Line: The indicator includes a dashed horizontal line at the zero level, representing a balance point between buyer and seller dominance. When the green and red columns cross this line, it signifies shifts in market sentiment.
How it Works:
The script divides the historical price data into segments of specified candle count (`n`) and assesses each segment's dominance. It calculates the volume associated with both green (bullish) and red (bearish) candles within each segment.
If a candle's closing price is higher than its opening price, it is considered a green candle. Similarly, if the closing price is lower than the opening price, the candle is classified as red. The volume of each respective type of candle is then accumulated for each segment.
The script plots the cumulative green candle volume as the "Buyer Dominance" column and the cumulative red candle volume as the "Seller Dominance" column. This visual representation helps traders gauge the ebb and flow of buyer and seller strength in the market.
Disclaimer :
The indicator is provided for informational purposes only and should not be considered as financial advice. It's important to conduct thorough research and analysis before making any trading decisions. The creator, Deepanshu Sharma, and "The Market Wisdom" team are not responsible for any trading losses incurred based on the usage of this indicator.
Remember that trading involves risks, and historical performance may not necessarily predict future results. Always consider multiple indicators, market trends, and risk management strategies when making trading decisions.
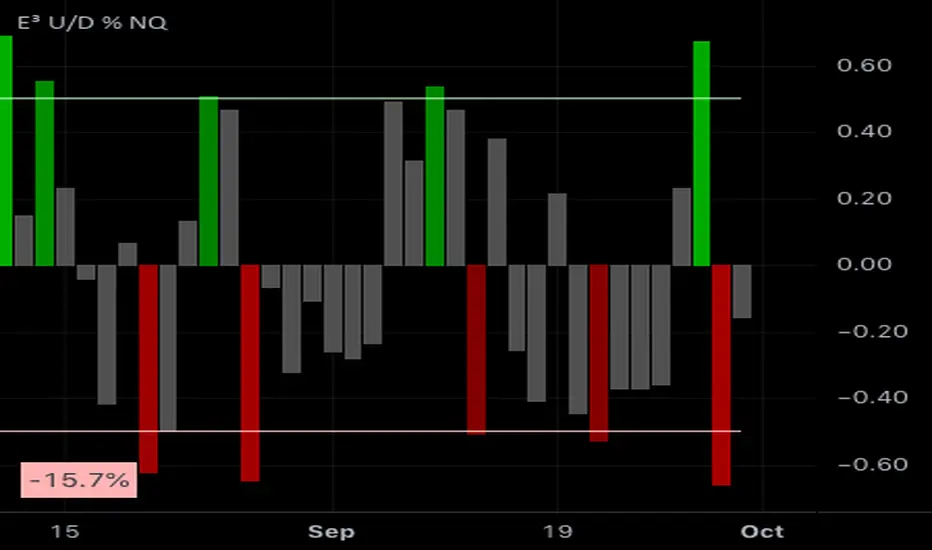
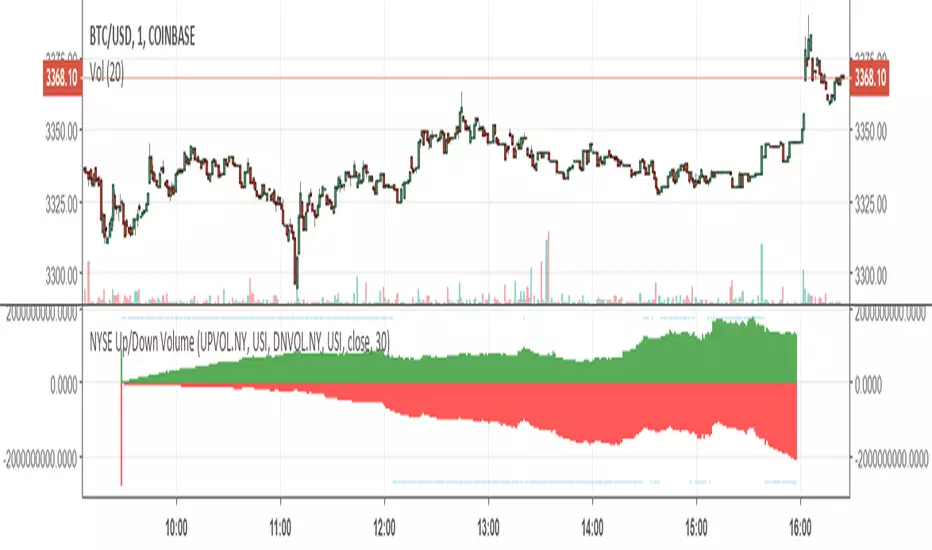
E³ Up-Down Volume % (NASDAQ)This lower indicator will show what % a day's total market volume on the NASDAQ COMPOSITE is bullish or bearish. It shows a history of every day's reading on a lower indicator pane.
Strong readings correspond to strong days and the differential in volume can often be ascertained from the market open and in the first 5-30 minutes of the market, to give you a sense of how the market might play out that day.
It is especially good at predicting STRONGEST days as well as DOJI days (indecision days).
EXAMPLES:
A +1% reading would mean that there is 1% more up volume on the day than down volume, meaning it's nearly a DOJI day or indecisive day where up down volume is basically 50/50 and the day is not particularly bullish (or bearish). Same goes for a very low bearish reading such as -1%.
an 80% BULLISH reading would mean that the day's volume differential is hugely favoring the bullside (buying demand). These days are so strong in sentiment that they usually end up being STRONG BULLISH CONTINUATION candles with little to no topside wick by the end of the day.
Conversely an 80% bearish candle would mean an intensely strong sell-side volume day.
TECHNICALLY:
90% bullish = 95% of the volume on the day is UP (very rare, ie: once every 2+ years)
80% bullish = 90% of the volume is UP (rare, ie: once or twice a year)
50% bullish = 75% of volume is UP (significant when it occurs, but not uncommon)
0-1% bullish = 50% of volume is up
-50% bearish = 75% of the volume is DOWN
-80% bearish = 90% of the volume is DOWN
-90% bearish = 95% of the volume is DOWN
OPTIMUM SETTINGS = Threshold Percent to 45-55%
This means that roughly 3/4 of the volume transpiring(ed) on the day is either UP or DOWN and will color the histogram if levels are that strong (either bullish or bearish)
Lowry Up/Down % VolumeShows the Up/Down volume %.
Carefully picked the color scheme of the bars so it's easy to see 80%/90% up/down days.
Added marks to highlight the 80/90% up/down days.

Improved Lowry Up-Down Volume + Stocks Indicatordocs.cmtassociation.org
In Paul F. Desmond's award winning paper in 2002 entitled "Identifying Bear Market Bottoms and New Bull Markets", he proposed an indicator for panic buying and selling that can be used to determine major market bottoms.
The paper explains that in major bear markets, you should have at least one, or more than one multiple 90% down days. Recoveries out of bear markets, or beginnings of new bull markets, should have at least one of the following conditions:
1) At least one 90% up volume day
2) At least two back-to-back 80% up volume days
Up and Down volume are defined as:
1) 90% up volume - defined as 90% up volume / total volume (or 10% down volume / total volume)
2) 90% down volume - defined as 90% down volume / total volume (or 10% up volume / total volume)
Several scripts exist in Tradingview to show this indicator for Up and Down volume, along with arrows or indicators for green up days or red down days.
However, this script is an improved version as it allows you the option to customize a couple parameters:
1) You may chose whether you'd like to use volume or stocks - sometimes it's better to have confluence between volume and actual stocks at the 90% threshold
2) You may chose the exchanges to consider - in the paper the NYSE is discussed, but this allows the expansion into NYSE, NASDAQ, DOW, and even a combined NYSE + NASDAQ + DOW indicator
3) It uniquely codes in the ability to plot a buy signal for both 90% up days, but also two back-to-back 80% up days - which is in the spirit of the original paper
I hope you enjoy this script and please let me know if you'd like me to make any modifications or additions.
Thank you, sincerely,
Jim Bosse

Volume Trend Meter LTFA new take to an already popular indicator of mine, now with lower time frame support for a volume called Volume Trend Meter LTF (VTML).
The VTM LTF indicator measures the volume pressure at a specific part of the candle (Start, Middle, or the end of the candle) and displays it as a histogram.
This indicator sums up all green candle volumes and red candle volumes over the selected part of the candle (Select in settings - start end or middle) and plots their values by subtracting increasing volume and decreasing volume.
Use this indicator to identify increasing volume with the green candles (close bigger than open) and increasing volume of the red candles (close is smaller than open).
Can also work on daily charts and higher.
======= Calculation ==========
For Green Column: The total Volume of green candles is higher than the total red candle volume.
For Red Column: The total Volume of red candles is higher than the total green candle volume.
======= Volume Trend Meter LTF Colors =======
Green: Increasing buying pressure.
Red: Increasing selling pressure.
My original VTM (not the lower time frame version):
Like if you like and Follow me for upcoming indicators/strategies: www.tradingview.com

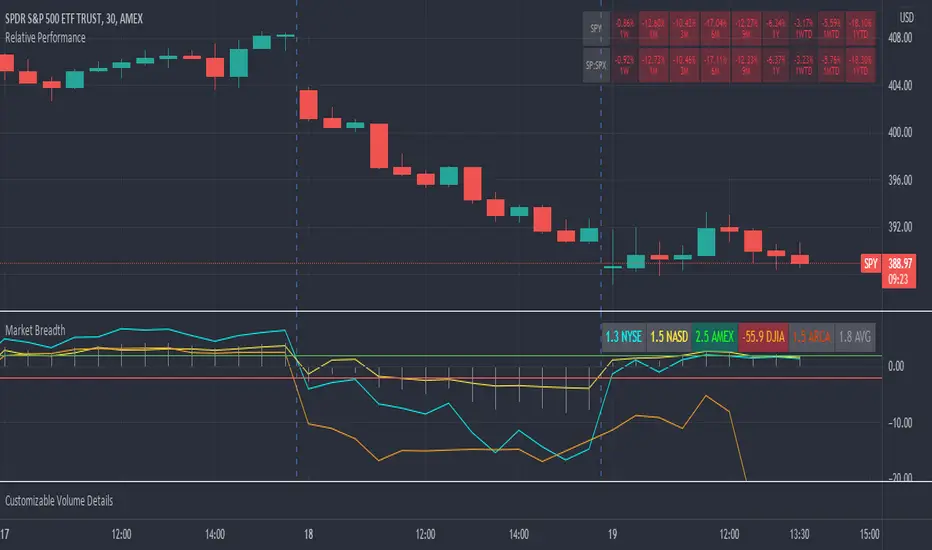
Market Breadth RatiosThis indicator provides breadth ratios for various indices/exchanges based on the up/down volume.
Breadth ratios included for NYSE, NASDAQ, AMEX, DJIA, ARCA, and and average.
Very straight forward to use, if the ratios is above 2, stocks should be in uptrend, below -2 stocks should trend down. In between 2 and -2 is going to be a choppy market.
BANKNIFTY Auto-Trading Indicator based on Market InternalsNSE:BANKNIFTY
Dear Fellow Traders,
This indicator for BankNifty INTRADAY trading is based on Market Internals - Advance/Decline Volume and TICK
These Market Internals, also known as Breadth Tools helps in identifying the overall market sentiment.
Just doing some technical analysis on Price action doesn't provide good results.
Price action along with Volume gives a meaningful insight and helps in improving the accuracy.
But simple VOLUME information is not sufficient to take a directional view on the markets. A segmentation of POSITIVE and NEGATIVE volume gives a clear picture of the symbol movement.
We can get the volume information FOR ANY STOCKS anywhere. But, VOLUME INFORMATION FOR AN INDEX ALONG WITH POSITIVE AND NEGATIVE VOLUMES are not available in normal trading platforms. And this tool provides the exact feature.
In a nutshell,
1) THIS TOOL PROVIDES BUY/SELL INDICATIONS on the BANKNIFTY based on the underlying stocks' PRICE AND VOLUME
2) THE VOLUME INFORMATION IS BIFURCATED INTO POSITIVE AND NEGATIVE VOLUME , WHICH HELPS IN DECIDING THE MARKET DIRECTION.
P.S: This is an Invite-only indicator. Inbox me for getting access.

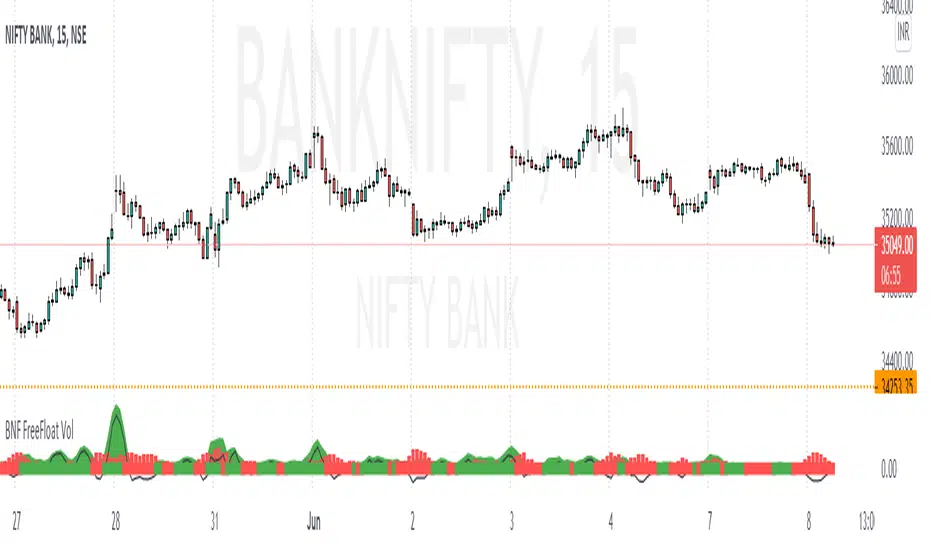
BANKNIFTY Free Float VolumeThis indicator is build keeping in mind how the Indian Market is formed - free-float market capitalization concept
1) Considered all banknifty index stocks according to NSE
2) Multiplied each stock Volume by its Weightage given in NSE Site every month End - means giving importance to volume by its weightage
3) Green Candle - Considered as +Ve Volume , Red Candle - Considered as -Ve Volume
4) Diff of +Ve Volume & -Ve Volume give clear picture market will go up or down
Note:- This Indicator work only for 15 Min time frame
Gives better results good Risk Reward used near Supp/Resistance
Combine with BANKNIFTY / NIFTY Advance-Decline Ratio give confidence on the move
Eg:-
Bullish Scenario
Near Support, Volume Turned -Ve to +Ve, Adv /Dec of Nifty >30/35 or BNF Adv /Dec > 7
or combine any candle patterns( Pin Bar ) at Sup/Res or combine with Chart Pattern(Triangle/ Rectangle )
Can take 75 Pts as SL and target 150-200 Pts
Bearish Scenario - Vice Versa to above
backtested results showed high Accuracy when used in combination of Sup/Res
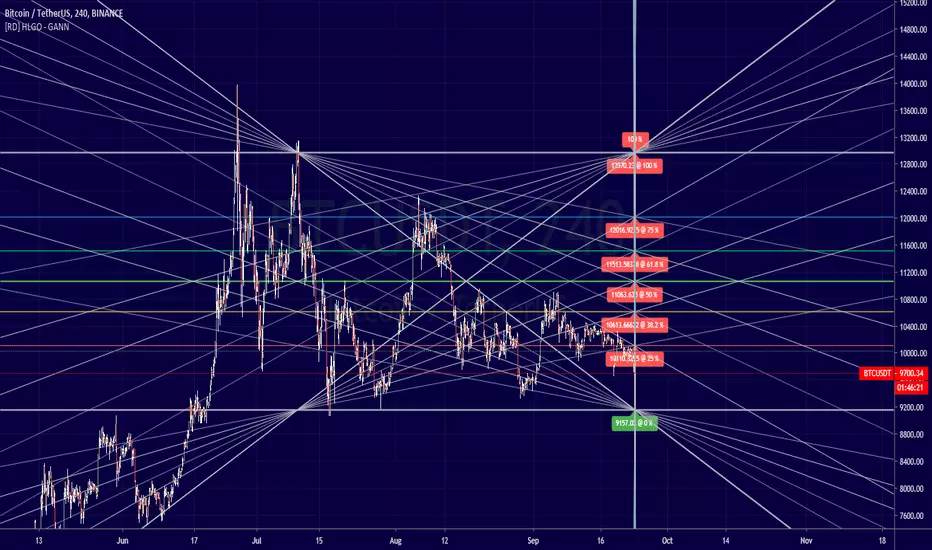
[RD] HLGO - GANN fibonacci (square/box, based on bars, h&l)==================================================================
Sept 24 - 2019 - HLGO - GANN V1
==================================================================
==================================================================
Description
==================================================================
Script to plot a gann related model (square / box ), try the different params.
Next version will be a time based version. Current version uses bars
(aka bar_index) so it can't plot beyond the last bar accept by extending
===================================================================
Version : v1 (notes
===================================================================
NaN
===================================================================
PLEASE -TIP- (we are trying to raise ₿100 to educate the wales)
===================================================================
BTC: 1C7sk3x8o2sX5eBV5HSz3KAgXJJ3FsF2Mo
ETH: 0xa14f3059EcDAE4aEe2E17826033E1D2C7e83233e
BNB: bnb1kwe3hqp4e8ch02ruhpclau4tvf0enzzh5tc2e3
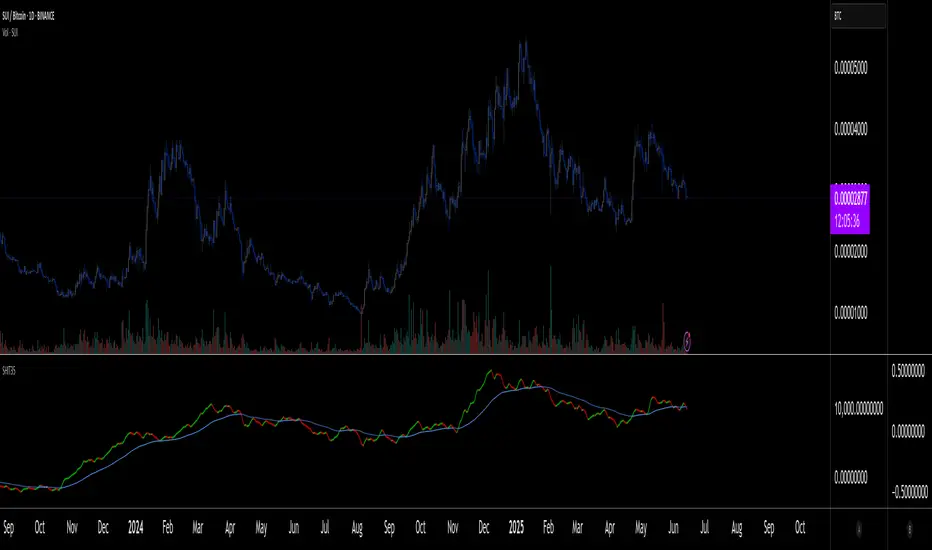
SHIT35 Alt Index (ROC or Volume) [LucF]SHIT35 is an index of 35 Binance alt/BTC pairs. It provides traders with a more reliable read of BTC pairs price movement than the often uncorrelated USD market cap standard.
Because it must read data coming from 35 markets, SHIT35 is painfully slow and should be kept hidden most of the time. Its features will hopefully seduce traders in using it nonetheless for market analysis.
Features
The Index can be calculated using 4 different modes:
1. Total of instant rate of change for all 35 markets ,
2. Cumulative total of ROCs,
3. Average of ROCs,
4. Plus/Minus volume (an aggregate OBV, if you will).
Select only one of the methods at a time to prevent confusion between modes.
An option allows showing the correlation between the Index as it is configured, and another instrument (CRYPTOCAP:TOTAL2 by default).
Markers can be used to identify abnormal movements in the Index. They are generated using Index exits from Bollinger bands.
The chart shows the Index with, from top to bottom, the default mode with BTC pairs, with USDT pairs, then mode 2 and 4 for BTC pairs.
Index Components
The Index is not weighed. The 35 instruments composing the index all have equivalents in the USDT quote currency on Binance, so you can easily change to those pairs using the Settings. Choosing another exchange or quote currency will require modifications to the list of instruments in the indicator’s code, since if one of the markets cannot be found, the indicator will not work. If the instrument exists but has no history for some bars, zero values will be used for them.
Watchlists
I have created a watchlist for the 35 markets in each of the BTC and USDT quote currencies. To import the watchlists, save the text you’ll find at these links in a file named the way you want your watchlist to be named and import them using the “Import Watchlist…” function.
BTC Watchlist: pastebin.com
USDT Watchlist: pastebin.com
Alerts
You can define alerts on any combination of markers you configure. After defining the markers you want the alert to trigger on, make sure you are on the interval you want the alert to be monitoring at, then create the alert, select the indicator, use the default alert condition and choose your triggering window (usually “Once Per Bar Close”). Once the alert is created, you can change the indicator's inputs with no effect on the alert.
NIFTY Underlying Weighted Volume Advance and DeclineNIFTY Underlying Weighted Distribution of Volume Advance and Decline
Market Internal tool used for trading Nifty Futures and Options
Calculation Method: Underlying stocks Free Float Market capitalization weightage has been used to calculate the outcome.
Data Taken from IISL

Bowly J Death Metal Hyper Train Sir John Templeton
“The four most dangerous words in investing are: This time it's different.”
Advance/Decline Volume Line The Advancing-Declining Volume Line (AD Volume Line) is a breadth indicator
based on Net Advancing Volume, which is the volume of advancing stocks less
the volume of declining stocks. Net Advancing Volume is positive when advancing
volume exceeds declining volume and negative when declining volume exceeds
advancing volume. The AD Volume Line is a cumulative measure of Net Advancing
Volume. It rises when Net Advancing Volume is positive and falls when Net
Advancing Volume is negative. Chartists plot the AD Volume Line for a specific
index and compare it to the performance of that index. The AD Volume Line should
confirm an advance or a decline with similar movements. Bullish or bearish
divergences in the AD Volume Line signal a change in buying or selling pressure
that could foreshadow a reversal in the index.
