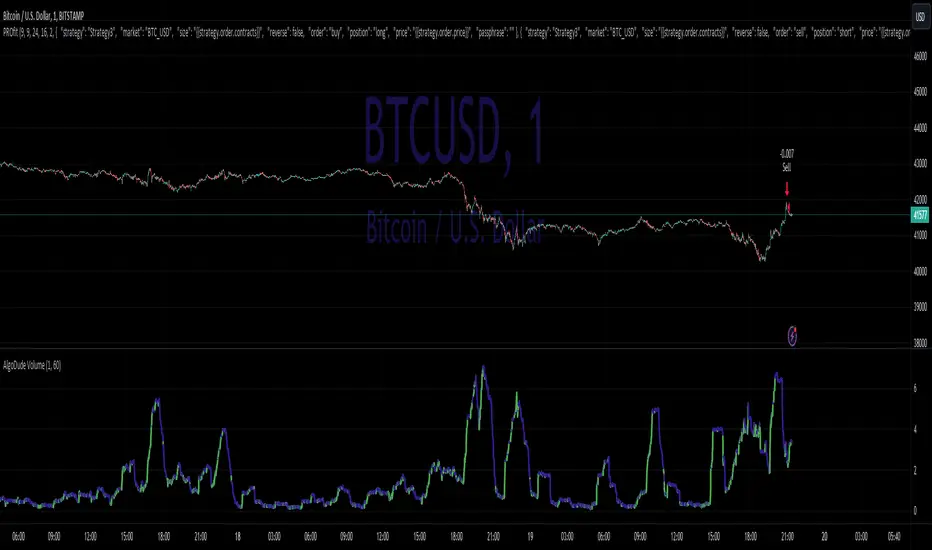
AlgoDude_Volume1. Timeframe Selection (selectedTimeframe):
Allows the user to choose the timeframe for the volume data analysis.
Options range from 1 minute to 1 month, including 1, 3, 5, 15, 30, 45 minutes, 1, 2, 3, 4 hours, and daily, weekly, monthly.
2.Moving Average Length (maLength):
Users can specify the length of the moving average applied to the inverse volume.
The range for this input is from 1 to 200 periods, with a default value of 14.
These inputs provide flexibility in analyzing volume data over various timeframes and smoothing the inverse volume data with a moving average of chosen length.
Linha de Avanço/Declínio de Volume
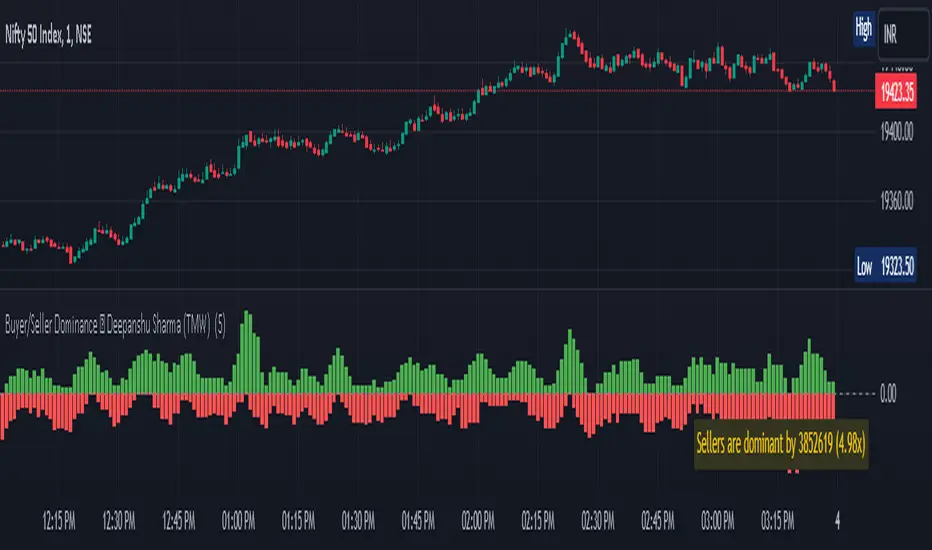
Buyer/Seller Dominance ©TMW
The "Buyer/Seller Dominance" indicator script, developed by Deepanshu Sharma under The Market Wisdom (TMW), is a powerful analytical tool designed for use on the TradingView platform. This script is released under the Mozilla Public License 2.0, and it offers traders and investors an innovative perspective on market dynamics by assessing the relative strength of buyers and sellers within a given time frame.
Key Features:
1. Dominance Calculation: The indicator calculates the dominance of buyers and sellers over a specified number of candles. Users can define the number of candles (`n`) to consider in the dominance calculation.
2. Visual Representation: The script provides a visual representation of buyer and seller dominance using colored columns on the price chart. Green columns represent buyer dominance, while red columns represent seller dominance.
3. Balance Line: The indicator includes a dashed horizontal line at the zero level, representing a balance point between buyer and seller dominance. When the green and red columns cross this line, it signifies shifts in market sentiment.
How it Works:
The script divides the historical price data into segments of specified candle count (`n`) and assesses each segment's dominance. It calculates the volume associated with both green (bullish) and red (bearish) candles within each segment.
If a candle's closing price is higher than its opening price, it is considered a green candle. Similarly, if the closing price is lower than the opening price, the candle is classified as red. The volume of each respective type of candle is then accumulated for each segment.
The script plots the cumulative green candle volume as the "Buyer Dominance" column and the cumulative red candle volume as the "Seller Dominance" column. This visual representation helps traders gauge the ebb and flow of buyer and seller strength in the market.
Disclaimer :
The indicator is provided for informational purposes only and should not be considered as financial advice. It's important to conduct thorough research and analysis before making any trading decisions. The creator, Deepanshu Sharma, and "The Market Wisdom" team are not responsible for any trading losses incurred based on the usage of this indicator.
Remember that trading involves risks, and historical performance may not necessarily predict future results. Always consider multiple indicators, market trends, and risk management strategies when making trading decisions.
Lowry Up/Down % VolumeShows the Up/Down volume %.
Carefully picked the color scheme of the bars so it's easy to see 80%/90% up/down days.
Added marks to highlight the 80/90% up/down days.

Improved Lowry Up-Down Volume + Stocks Indicatordocs.cmtassociation.org
In Paul F. Desmond's award winning paper in 2002 entitled "Identifying Bear Market Bottoms and New Bull Markets", he proposed an indicator for panic buying and selling that can be used to determine major market bottoms.
The paper explains that in major bear markets, you should have at least one, or more than one multiple 90% down days. Recoveries out of bear markets, or beginnings of new bull markets, should have at least one of the following conditions:
1) At least one 90% up volume day
2) At least two back-to-back 80% up volume days
Up and Down volume are defined as:
1) 90% up volume - defined as 90% up volume / total volume (or 10% down volume / total volume)
2) 90% down volume - defined as 90% down volume / total volume (or 10% up volume / total volume)
Several scripts exist in Tradingview to show this indicator for Up and Down volume, along with arrows or indicators for green up days or red down days.
However, this script is an improved version as it allows you the option to customize a couple parameters:
1) You may chose whether you'd like to use volume or stocks - sometimes it's better to have confluence between volume and actual stocks at the 90% threshold
2) You may chose the exchanges to consider - in the paper the NYSE is discussed, but this allows the expansion into NYSE, NASDAQ, DOW, and even a combined NYSE + NASDAQ + DOW indicator
3) It uniquely codes in the ability to plot a buy signal for both 90% up days, but also two back-to-back 80% up days - which is in the spirit of the original paper
I hope you enjoy this script and please let me know if you'd like me to make any modifications or additions.
Thank you, sincerely,
Jim Bosse

Volume Trend Meter LTFA new take to an already popular indicator of mine, now with lower time frame support for a volume called Volume Trend Meter LTF (VTML).
The VTM LTF indicator measures the volume pressure at a specific part of the candle (Start, Middle, or the end of the candle) and displays it as a histogram.
This indicator sums up all green candle volumes and red candle volumes over the selected part of the candle (Select in settings - start end or middle) and plots their values by subtracting increasing volume and decreasing volume.
Use this indicator to identify increasing volume with the green candles (close bigger than open) and increasing volume of the red candles (close is smaller than open).
Can also work on daily charts and higher.
======= Calculation ==========
For Green Column: The total Volume of green candles is higher than the total red candle volume.
For Red Column: The total Volume of red candles is higher than the total green candle volume.
======= Volume Trend Meter LTF Colors =======
Green: Increasing buying pressure.
Red: Increasing selling pressure.
My original VTM (not the lower time frame version):
Like if you like and Follow me for upcoming indicators/strategies: www.tradingview.com

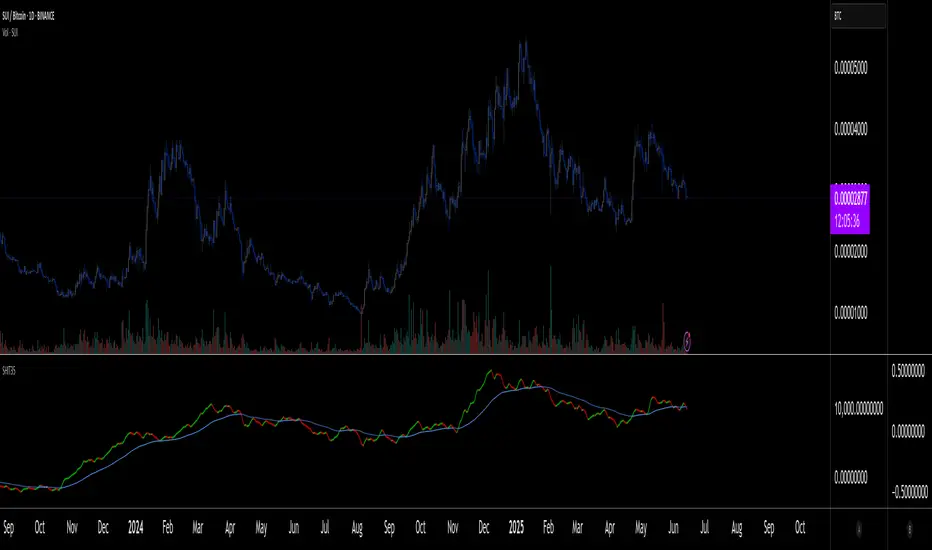
SHIT35 Alt Index (ROC or Volume) [LucF]SHIT35 is an index of 35 Binance alt/BTC pairs. It provides traders with a more reliable read of BTC pairs price movement than the often uncorrelated USD market cap standard.
Because it must read data coming from 35 markets, SHIT35 is painfully slow and should be kept hidden most of the time. Its features will hopefully seduce traders in using it nonetheless for market analysis.
Features
The Index can be calculated using 4 different modes:
1. Total of instant rate of change for all 35 markets ,
2. Cumulative total of ROCs,
3. Average of ROCs,
4. Plus/Minus volume (an aggregate OBV, if you will).
Select only one of the methods at a time to prevent confusion between modes.
An option allows showing the correlation between the Index as it is configured, and another instrument (CRYPTOCAP:TOTAL2 by default).
Markers can be used to identify abnormal movements in the Index. They are generated using Index exits from Bollinger bands.
The chart shows the Index with, from top to bottom, the default mode with BTC pairs, with USDT pairs, then mode 2 and 4 for BTC pairs.
Index Components
The Index is not weighed. The 35 instruments composing the index all have equivalents in the USDT quote currency on Binance, so you can easily change to those pairs using the Settings. Choosing another exchange or quote currency will require modifications to the list of instruments in the indicator’s code, since if one of the markets cannot be found, the indicator will not work. If the instrument exists but has no history for some bars, zero values will be used for them.
Watchlists
I have created a watchlist for the 35 markets in each of the BTC and USDT quote currencies. To import the watchlists, save the text you’ll find at these links in a file named the way you want your watchlist to be named and import them using the “Import Watchlist…” function.
BTC Watchlist: pastebin.com
USDT Watchlist: pastebin.com
Alerts
You can define alerts on any combination of markers you configure. After defining the markers you want the alert to trigger on, make sure you are on the interval you want the alert to be monitoring at, then create the alert, select the indicator, use the default alert condition and choose your triggering window (usually “Once Per Bar Close”). Once the alert is created, you can change the indicator's inputs with no effect on the alert.
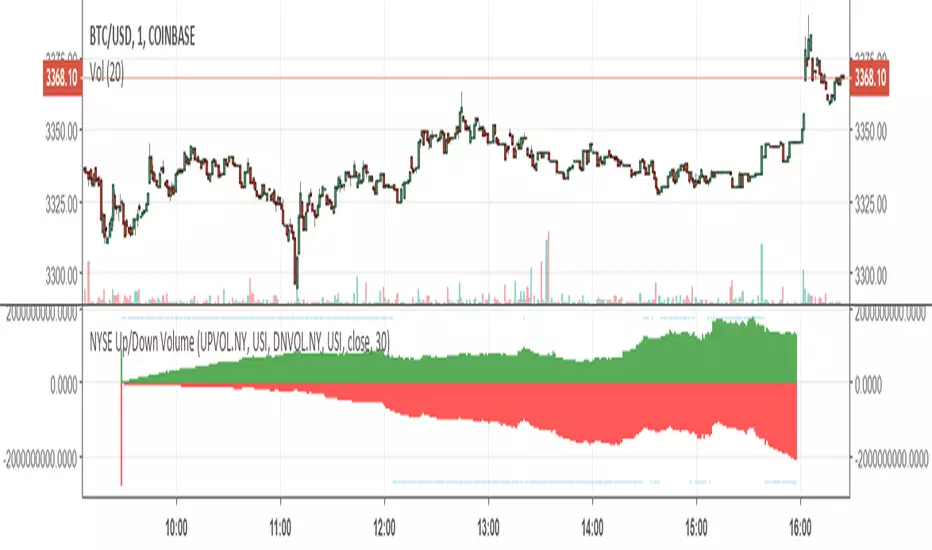
Advance/Decline Volume Line The Advancing-Declining Volume Line (AD Volume Line) is a breadth indicator
based on Net Advancing Volume, which is the volume of advancing stocks less
the volume of declining stocks. Net Advancing Volume is positive when advancing
volume exceeds declining volume and negative when declining volume exceeds
advancing volume. The AD Volume Line is a cumulative measure of Net Advancing
Volume. It rises when Net Advancing Volume is positive and falls when Net
Advancing Volume is negative. Chartists plot the AD Volume Line for a specific
index and compare it to the performance of that index. The AD Volume Line should
confirm an advance or a decline with similar movements. Bullish or bearish
divergences in the AD Volume Line signal a change in buying or selling pressure
that could foreshadow a reversal in the index.
