BT Delta AbsorptionBT Absorption detects aggressive counterflow volume—moments where one side
of the market (buyers or sellers) attacks aggressively, yet price fails to move
proportionally.
This is the classic definition of absorption:
"Large market orders are being absorbed by strong passive limit orders."
Absorption is one of the most reliable early signals for:
Reversals
Trap conditions
Failed breakouts
Liquidity grabs
Fake displacement moves
---
■ What BT Absorption Measures
1. Delta Imbalance
Identifies when buying or selling pressure becomes unusually one-sided.
2. Volatility Mismatch
Shows when large delta does NOT translate into meaningful price movement.
3. Absorption Strength Score
A normalized reading (often 0–100) showing the intensity of counterflow activity.
4. Wick & Structure Absorption
Wick-driven absorption helps identify:
Failed sweeps
Stop hunts
Rejection zones
Trapped traders
---
■ Why Absorption Matters
Absorption almost always precedes:
Reversals
Failed breakout moves
SMC/ICT-style displacement
Order block formation
Trend continuation after a trap
When aggressive traders cannot move price toward their desired direction,
the move typically reverses quickly—and with force.
---
■ Visual Elements
• Bull Absorption Marker
Often appears near lows—signals seller aggression failing to push price down.
• Bear Absorption Marker
Often appears near highs—signals buyer aggression failing to break higher.
• Absorption Score Heatmap (optional)
Shows intensity of absorption per candle.
• Threshold Levels
Identify when absorption becomes statistically significant.
---
■ How to Use BT Absorption in Trading
1. Reversal Detection
Look for absorption after:
Equal highs/lows
Sweeps
Stop runs
Breakout failures
This is often the earliest possible signal that a reversal is coming.
2. Filter Breakouts
A breakout without absorption is usually weak.
A breakout with absorption against it is likely a fakeout.
3. Confirm SMC/ICT Concepts
The indicator pairs perfectly with:
Fair Value Gaps
Order Blocks
Liquidity sweeps
Displacement legs
If your setup triggers and absorption confirms → high confidence.
4. Identify Trap Conditions
Absorption often marks:
Trapped breakout chasers
Trapped trend shorts
Imbalanced orderflow
These create ideal high-R trades.
5. Alert-Driven Market Monitoring
Use alerts for:
Bull Absorption
Bear Absorption
High-strength absorption
Absorption clusters
This allows traders to step away from charts while still catching
high-probability reversals.
---
■ High-Probability Absorption Setups
A) Sweep + Absorption
Swept level → absorption → enter opposite direction.
B) Failed Breakout Absorption
Breaks structure → delta fails → absorption prints → strong reversal.
C) Trend Continuation Absorption
Absorption against the correction often precedes continuation.
D) Absorption Clusters
Multiple absorption signals indicate a structural market shift.
---
■ Final Summary
BT Absorption provides:
Early reversal signals
Counterflow pressure detection
Confirmation for existing setups
Identification of liquidity traps
Alert-based monitoring across multiple markets
BT Absorption is the perfect complement to BT Spike:
• BT Spike = detects volatility ignition
• BT Absorption = detects failed aggression + reversals
Combined, they form a complete liquidity and orderflow toolkit.
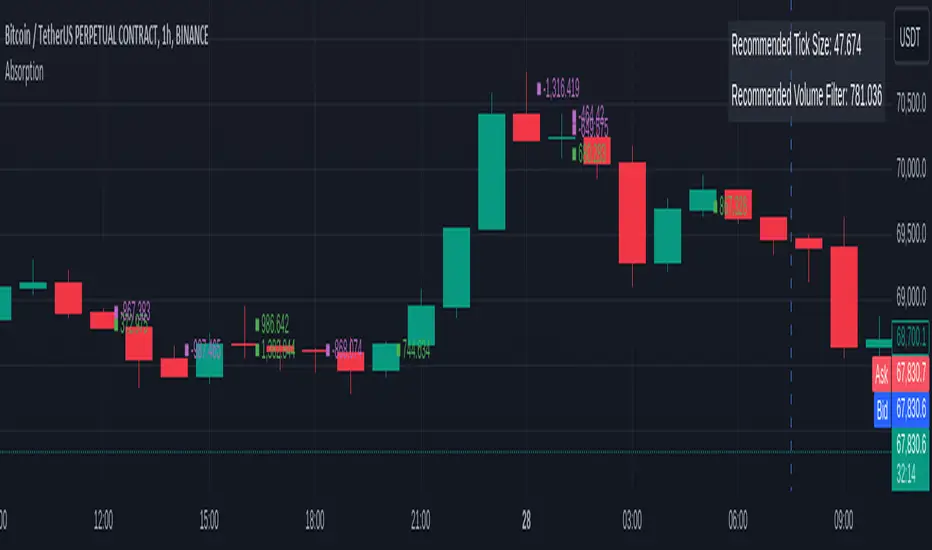
Absorptionvol

OrderFlow Absorption IndicatorWhat it Does
The OrderFlow Absorption Indicator marks areas where the price absorbs a large volume of aggressive market trades. This indicates areas where price may bounce back due to large limit (resting) orders absorbing significant aggressor volume (market orders). Absorption can also be seen as "preventing" or "stopping" the other side from breaking through a price level (e.g. bids stopping an influx of sell market orders). Absorption may signal a change in sentiment, potentially leading to a pullback or reversal.
An Example of Absorption
Of course, it is not always the case that such bullish absorption will initiate a trend as the example above. The OrderFlow Absorption Indicator merely serves as a tool for spotting possible absorption points in the market which you can incorporate into your trading arsenal.
How it Works
The indicator actively monitors price changes and records volume accumulated at a price level. If the price bounces back to at least where it was before the current price move, the indicator records this as absorption, provided it meets the Volume Requirement and optional Time Requirement.
How to Use it
1. Set Parameters
Choose your desired tick size and volume filter value. If unsure, refer to the table on the top right of the chart for recommended values. An automatic volume limit filter mode is also available.
Automatic Limit Mode : Enable this mode to have the indicator automatically select a volume filter value. It calculates the standard deviation of the last n minutes of volume and multiplies it by a volume multiplier. You can adjust these parameters.
Higher Volume Filter : Setting a higher volume filter value results in fewer, but higher quality detections, reducing noise.
2. Enabling the Time Limit
Enabling the time limit further improves detection quality by filtering out price levels that can defend against quick, sudden aggressive orders, acting as confirmation and indicating strong sentiment and resilient liquidity.
3. Enabling Historical Data Absorption
The indicator can also detect absorption in historical data, though less accurately than in real-time due to OHLCV aggregation.
You can select the granularity of historical data.
Lower granularity (e.g., 1 second) : Provides more accurate detections but may slow down the indicator.
Higher granularity : Improves speed but reduces detection accuracy.
Other Features
Hovering : When hovering over an absorption point, the interface reveals the price where the absorption occurred, along with the volume absorbed by the bids and asks, as well as the volume filter value used.
Delta Mode : In Delta mode, the system calculates the difference between the volume absorbed by bids and asks, revealing points only when the absolute value of this difference exceeds the volume filter value. Especially useful for larger tick sizes.
Troubleshooting
If the indicator doesn't mark anything, it means the traded volume hasn't exceeded the set volume filter value within the specified price intervals(tick size) and time limit. Adjust these settings as necessary.
AbsorptionThis script is designed to alert one to the possible presence of hidden walls, or visible, that are absorbing a lot of volume without letting price change. Therefore acting as Support and Resistance.
