4ema

EMA Grid + Martingale Strategy (Long-Only) with CooldownTitle:
EMA Grid + Martingale Strategy (Long-Only) with Cooldown
Short Summary:
A long-only strategy combining EMA trend filters, grid-based entries, optional martingale sizing, and a cooldown feature to manage position timing and exits.
Full Description:
This strategy uses a 4-EMA trend confirmation system to detect bullish momentum, then deploys a grid-style entry method with optional martingale position sizing. It includes a cooldown mechanism to prevent reentry too soon after a completed trade cycle.
How It Works
1. Trend Confirmation: Two EMA groups (fast/slow) determine whether market conditions are bullish.
2. Initial Entry: A new position is entered when both EMA groups confirm an uptrend and no position is currently active.
3. Grid Entries: Additional long entries are placed when price drops by a defined pip distance from the last entry, respecting the maximum number of entries.
4. Martingale Sizing (Optional): Grid orders can increase in size with each level using a customizable multiplier.
5. Weighted-Average Exit: All positions close once price reaches or exceeds the average entry price plus a buffer.
6. Cooldown Timer: After closing a position set, the strategy waits a defined number of bars before opening a new grid.
Key Features
• 4 customizable EMAs for trend confirmation.
• Dynamic grid-style long entries based on pip intervals.
• Optional martingale-style position sizing.
• Weighted-average price exit logic with buffer control.
• Cooldown bar period to limit overtrading.
• Suitable for optimization and backtesting with full control over inputs.
Use Cases
• Designed for trending markets where pullbacks present entry opportunities.
• Helps manage staged entries while avoiding premature reentry.
• Ideal for testing martingale and grid-based strategies with exit precision.
Note: This strategy is for testing and educational purposes only. It does not guarantee profits and is not financial advice.

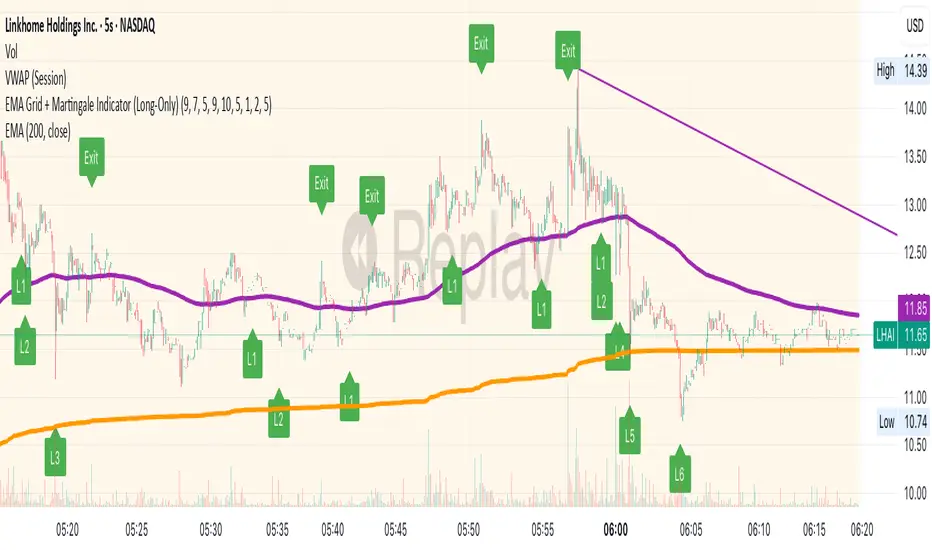
EMA Grid + Martingale Indicator (Long-Only)Title:
EMA Grid + Martingale Indicator (Long-Only)
Short Summary:
A 4-EMA trend filter combined with a grid-based entry system and optional martingale sizing to visualize staged long entries and exits in bullish markets.
Full Description:
This indicator combines a 4-EMA trend filter with a grid-based entry system and optional martingale-style position sizing to help traders visualize staged long entries and exits in trending markets.
How It Works
1. Trend Detection: Uses two sets of EMAs (fast/slow pairs) to confirm bullish momentum. A long signal is generated when both EMA groups align in an uptrend.
2. Grid Entries: After the initial long entry, additional grid levels are triggered every time price drops by the specified grid step (in pips).
3. Martingale Sizing (Optional): Each subsequent entry can increase in size based on the defined martingale factor.
4. Weighted-Average Exit: Calculates the weighted average of all grid entries and signals an exit when the price reaches or surpasses this level plus an optional buffer.
Key Features
• 4 EMA Trend Filter with fully customizable lengths.
• Dynamic grid entries with visual labels (L1, L2, etc.).
• Optional martingale position sizing.
• Weighted-average exit with adjustable buffer.
• Customizable parameters for EMAs, grid steps, max entries, and buffer pips.
• Clear chart visualization of EMAs and entry/exit levels.
Use Cases
• For traders using cost-averaging or grid strategies in bullish markets.
• Visualizes multiple entry levels and profit targets.
• Useful for backtesting and strategy planning.
Note: This indicator is for visualization and planning purposes only. It does not execute trades automatically. It does not guarantee profits and is not financial advice.

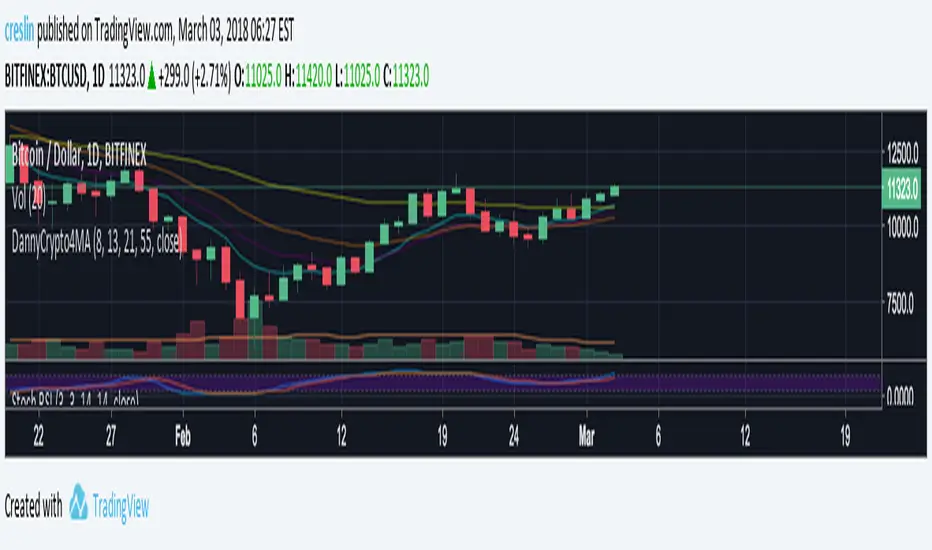
EMA Fib LinesThis indicator uses 4 Exponential Moving Averages (8, 13, 21, 55 - Fibonacci). You're looking for the averages to line up from top to bottom in this order: Blue, Green, Yellow, Red. Once this happens, use TA to find a good opportunity to enter a trade.


Philakone 55 EMA and MA Swing Trading by ZekisPhilakone 55 EMA and MA Swing Trading by Zekis
A swing strategy based on 4 EMAs (8, 13, 21 and 55) developed by Philakone with a nice succes rate on +2h charts
I tried to make it more friendly for the eye and easier to use
What i added:
***the ability to change from EMA to MA
***arrows for a better view for entries/longs and exits/shorts
***colors to determine the trend/entries and exits/longs and shorts
***targets (%) for take profit and Stop Loss (all marked with dots)
***alerts for all of above
Enter long when color between fastest line and slowest line turns green or when green arrow shows up
Enter short when color between fastest line and slowest line turns red or when red arrow shows up
Enjoy!
@ Zekis

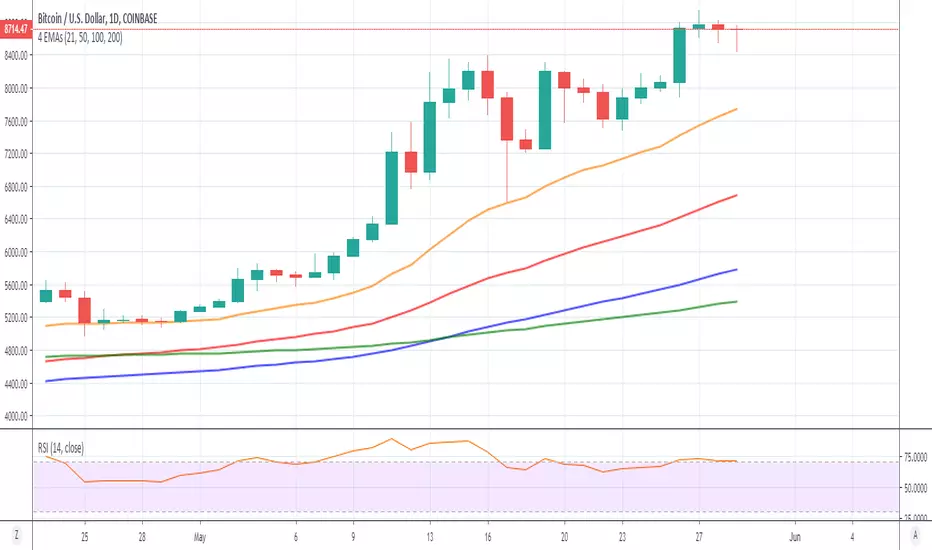
4EMA (8,13,21,55) + DC (100,200) + BB + S&R by @PIXELSNAPSHOTIn this indicator you find Total 6 EMA , 4 slow and same as fibonashi & another 2 is long term + you get death cross + you get Bollenger band + you get support & resistance indicator

QEMA - 4 Exponential Moving AveragesThese four EMA's can be used as a indicator to determine where the market is heading and if you should buy or sell. If you know how to use it, you can trade off of this alone.

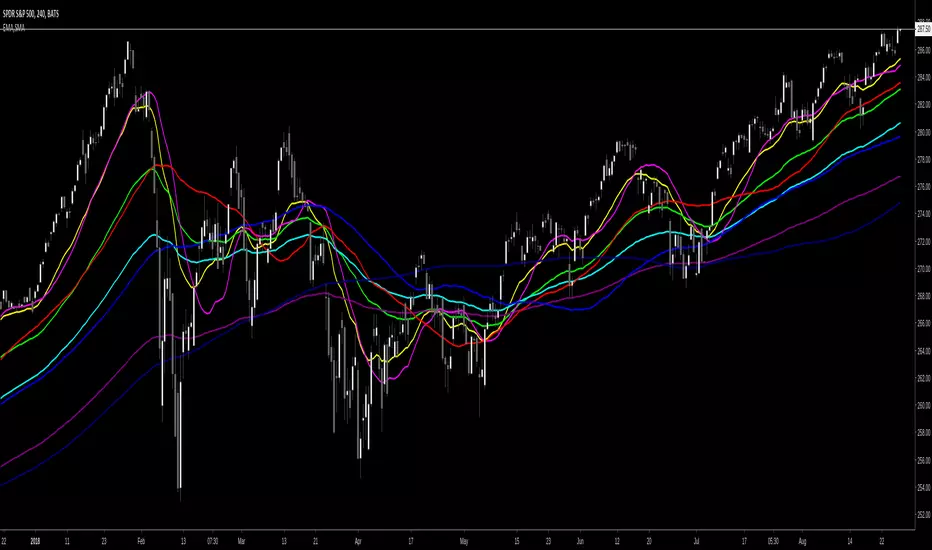
9 20 50 200 EMAsAll four 9 20 50 200 EMAs to save indicator space and have the most reliable, recognized and respected EMAs. For day trades i consider 9 and 20 EMAs pullbacks on 5 min charts when in overall uptrend . 50 EMA determines if in up or down trend by being above or below (50 EMA was be sloping up or down.
200 EMAs great support and resistance along with the slope of these EMAs are telling a strory, I also use EMA Boillinger Bands along with TTM Trend, Wave A & B , MFI, Volume Weighted MACD, VWAP, and Stoch RSI
Crypto Quad EMA 8,13,21,55Displays 8,13,21,55 EMAs on a single indicator.
Useful for Crypto trading and reduced the number of indicators needed to view multiple EMAs
When shorter EMAs cross over the longer its a good sign of Bullish/Bearish reversal.
This sentiment is more true at longer timeframes, such as daily candles, as the trend has more momentum.