FluidFlow OscillatorFluidFlow Oscillator: Study Material for Traders
Overview
The FluidFlow Oscillator is a custom technical indicator designed to measure price momentum and market flow dynamics by simulating fluid motion concepts such as velocity, viscosity, and turbulence. It helps traders identify potential buy and sell signals along with trend strength, momentum direction, and volatility conditions.
This study explains the underlying calculation concepts, signal logic, visual cues, and how to interpret the professional dashboard table that summarizes key indicator readings.
________________________________________
How the FluidFlow Oscillator Works
Core Mechanisms
1. Price Flow Velocity
o Measures the rate of change of price over a specified flow length (default 40 bars).
o Calculated as a percentage change of closing price: roc=close−closelen_flowcloselen_flow×100\text{roc} = \frac{\text{close} - \text{close}_{len\_flow}}{\text{close}_{len\_flow}} \times 100roc=closelen_flowclose−closelen_flow×100
o Smoothed by an EMA (Exponential Moving Average) to reduce noise, generating a "flow velocity" value.
2. Viscosity Factor
o Analogous to fluid viscosity, it adjusts the flow velocity based on recent price volatility.
o Volatility is computed as the standard deviation of close prices over the flow length.
o The viscosity acts as a damping factor to slow down the flow velocity in highly volatile conditions.
o This results in a "flow with viscosity" value, that smooths out the velocity considering market turbulence.
3. Turbulence Burst
o Captures sudden changes or bursts in the flow by measuring changes between successive viscosity-adjusted flows.
o The turbulence value is a smoothed absolute change in flow.
o A burst boost factor is added to the oscillator to incorporate this rapid change component, amplifying signals during sudden shifts.
4. Oscillator Calculation
o The raw oscillator value is the sum of flow with viscosity plus burst boost, scaled by 10.
o Clamped between -100 and +100 to limit extremes.
o Finally, smoothed again by EMA for cleaner visualization.
________________________________________
Signal Logic
The oscillator works with complementary components to produce actionable signals:
• Signal Line: An EMA-smoothed version of the oscillator for generating crossover-based signals.
• Momentum: The rate of change of the oscillator itself, smoothed by EMA.
• Trend: Uses fast (21-period EMA) and slow (50-period EMA) moving averages of price to identify market trend direction (uptrend, downtrend, or sideways).
Signal Conditions
• Bullish Signal (Buy): Oscillator crosses above the oversold threshold with positive momentum.
• Bearish Signal (Sell): Oscillator crosses below the overbought threshold with negative momentum.
Statuses
The oscillator provides descriptive market states based on level and momentum:
• Overbought
• Oversold
• Buy Signal
• Sell Signal
• Bullish / Bearish (momentum-driven)
• Neutral (no clear trend)
________________________________________
Color System and Visualization
The oscillator uses a sophisticated HSV color model adapting hues according to:
• Oscillator value magnitude and sign (positive or negative)
• Acceleration of oscillator changes
• Smooth color gradients to facilitate intuitive understanding of trend strength and momentum shifts
Background colors highlight overbought (red tint) and oversold (green tint) zones with transparency.
________________________________________
How to Understand the Professional Dashboard Table
The FluidFlow Oscillator offers an integrated table at the bottom center of the chart. This dashboard summarizes critical indicator readings in 8 columns across 3 rows:
Column Description
SIGNAL Current signal status (e.g., Buy, Sell, Overbought) with color coding
OSCILLATOR Current oscillator value (-100 to +100) with color reflecting intensity and direction
MOMENTUM Momentum bias indicating strength/direction of oscillator changes (Strong Up, Up, Sideways, Down, Strong Down)
TREND Current trend status based on EMAs (Strong Uptrend, Uptrend, Sideways, Downtrend, Strong Downtrend)
VOLATILITY Volatility percentage relative to average, indicating market activity level
FLOW Flow velocity value describing price momentum magnitude and direction
TURBULENCE Turbulence level indicating sudden bursts or spikes in price movement
PROGRESS Oscillator's position mapped as a percentage (0% to 100%) showing proximity to extreme levels
Rows Explained
• Row 1 (Header): Labels for each metric.
• Row 2 (Values): Current numerical or descriptive values color-coded along a professional scheme:
o Green or lime tones indicate positive or bullish conditions.
o Red or orange tones indicate caution, sell signals, or bearish conditions.
o Blue tones indicate neutral or stable conditions.
• Row 3 (Status Indicators): Emoji-like icons and bars provide a quick visual gauge of each metric's intensity or signal strength:
o For example, "🟢🟢🟢" suggests very strong bullish momentum, while "🔴🔴🔴" suggests strong bearish momentum.
o Progress bar visually demonstrates oscillator movement toward oversold or overbought extremes.
________________________________________
Practical Interpretation Tips
• A Buy signal with green colors and strong momentum usually precedes upward price moves.
• An Overbought status with red background and red table colors warns of potential price corrections or reversals.
• Watch the Turbulence to gauge market instability; spikes may precede price shocks or volatility bursts.
• Confirm signals with the Trend and Momentum columns to avoid false entries.
• Use the Progress bar to anticipate oscillations approaching key threshold levels for timing trades.
________________________________________
Alerts
The oscillator supports alerts for:
• Buy and sell signals based on oscillator crossovers.
• Overbought and oversold levels reached.
These help traders automate awareness of important market conditions.
________________________________________
Disclaimer
The FluidFlow Oscillator and its signals are for educational and informational purposes only. They do not guarantee profits and should not be considered as financial advice. Always conduct your own research and use proper risk management when trading. Past performance is not indicative of future results.
________________________________________
This detailed explanation should help you understand the workings of the FluidFlow Oscillator, its components, signal logic, and how to analyze its professional dashboard for informed trading decisions.
#cashflow

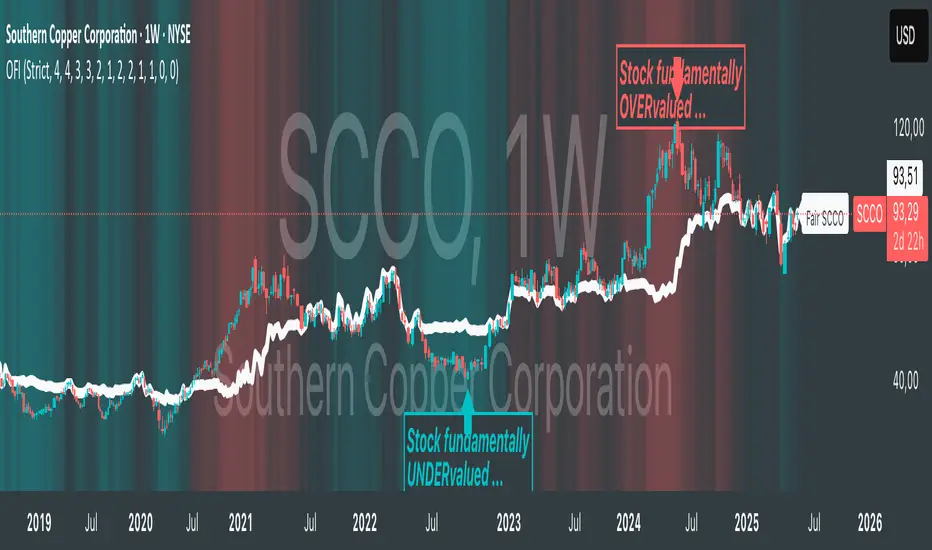
Oster's Fair Index (OFI)Note : Excitingly, this indicator is optimized to work exclusively with weekly candles (1W) ! Because fundamental analyses, with their longer-term outlook, thrive on the broader perspective provided by weekly data.
Overview:
Oster's Fair Index (OFI) stands out as a sophisticated indicator to offer traders a comprehensive assessment of a stock's fundamental valuation. Unlike many conventional indicators that focus solely on technical analysis, OFI places a strong emphasis on fundamental metrics, providing traders with a deeper understanding of a stock's intrinsic worth. It applies Oster's method (explained below) to determine the fundamental fair price of a stock.
Innovative Approach to Fundamental Analysis:
OFI employs a unique approach to fundamental analysis, integrating multiple key metrics including Yield , P/S (Price-to-Sales) ratio , P/E (Price-to-Earnings) ratio , Debt/Asset ratio , and P/FCF (Price-to-Free-Cash-Flow) ratio . These metrics collectively offer a holistic view of a company's financial health, allowing traders to gauge its potential for growth and profitability. Notably, the fundamental metrics included in OFI are regarded as the most crucial indicators for fundamental stock evaluation according to Oster's method. Dividend yield and P/S ratio are prioritized as the most significant, followed by the P/E ratio, with supplementary consideration given to the debt-to-asset ratio and price-to-free cash flow ratio. This weighting reflects their importance in determining a stock's fair value according to the methodology, which is integrated into OFI's calculation process.
Customizable Parameters for Tailored Analysis:
One of OFI's standout features is its flexibility, allowing users to customize the fundamental parameters based on their specific investment strategy or preferences. Traders can selectively include or exclude metrics , adjust weighting factors , and set alarm thresholds to align with their unique trading objectives. This customization empowers traders to tailor OFI according to their individual preferences and market perspectives. Although a default value has been set for the weighting of the parameters, traders still have the option to customize it based on their own trading strategy and preference, ensuring that OFI remains adaptable to diverse trading styles and objectives.
Sophisticated Calculation Methodology:
Behind the scenes, OFI employs a sophisticated calculation methodology to derive its insights. It retrieves fundamental data for the selected stock, such as total revenue, earnings per share, debt-to-asset ratio, free cash flow per share, and dividend yield. However, these metrics are not viewed in isolation; rather, they are considered in relation to historical trends . For instance, while a low debt-to-asset ratio may indicate fundamental strength for a company, it must be interpreted in the context of its historical performance. If the debt-to-asset ratio has historically been consistently lower, it may suggest weaker performance despite the seemingly favorable current ratio. Furthermore, OFI goes beyond mere fundamental metrics by incorporating the stock price itself into its analysis . A low debt-to-asset ratio becomes even more attractive for the company if the stock price is also historically low, indicating undervaluation. OFI takes all these aspects into account, providing traders with a comprehensive and nuanced evaluation of a stock's fundamental attractiveness, considering all these aspects in relation to each of the fundamental metrics mentioned above.
Normalized Fairness Differentials for Standardized Comparison:
OFI employs a method where the aforementioned fundamental metrics interact as described earlier. These metrics are combined into a fundamental, normalized value using weighting factors. This value is then normalized by the moving price range of the last 12 months. The result provides insights not only into when the stock price was undervalued, overvalued, or fair, but also enables traders to estimate potential price movements based on the fundamental health of the company. Additionally, a dashed fair price line simply represents the sum of the current stock price and the OFI value. This line illustrates the fair price level of the stock derived from the methodology.
Interpretation:
A negative OFI indicates that the stock may be undervalued based on fundamental metrics. Conversely, a positive OFI suggests that the stock may be overvalued according to fundamental analysis. A zero OFI implies that the stock is trading at a fair price relative to its fundamentals, indicating a balanced valuation scenario. The values of OFI are not arbitrary; they represent the degree of overvaluation or undervaluation in the currency set in the chart settings. This means traders can discern, for example, how many USD the stock is undervalued or overvalued by . Additionally, a dashed fair price line simply represents the sum of the current stock price and the OFI value, illustrating the fair price levels of the stock derived from the methodology.
Dynamic Color Coding for Visual Clarity:
To enhance usability, OFI features dynamic color coding that visually highlights the fair price differentials. Green signifies potential undervaluation , red indicates potential overvaluation , and neutral colors represent fair valuation . This intuitive visual feedback enables traders to quickly identify opportunities and risks.
Alerts:
OFI generates alerts based on these interpretations to assist traders in making informed decisions. An Undervalued Signal (BUY) is triggered when the OFI is below zero and meets the buy threshold criteria. This indicates that the stock is fundamentally undervalued, prompting a BUY alert. Conversely, an Overvalued Signal (SELL) is generated when the OFI surpasses zero and meets the sell threshold criteria. This signals that the stock is fundamentally overvalued, prompting a SELL alert. When OFI hovers around zero, suggesting that the stock is trading at a fair price, a Fair Price Reached (FAIR) alert is generated. This encourages traders to consider profit-taking strategies given the balanced valuation.
Justification of Originality and Value:
In a landscape saturated with technical indicators, OFI distinguishes itself by offering traders a refreshingly simple yet powerful approach to fundamental analysis. While traditional methods often involve laborious scrutiny of financial metrics or even poring over entire company balance sheets, OFI streamlines this process, providing traders with a swift overview of a stock's fundamental health. Its strength lies in seamlessly integrating fundamental analysis with stock price movements, offering insights into how price correlates with fundamental metrics.
One could say we marry the simplicity of technical analysis with the depth of fundamental analysis. This unique combination empowers traders to make informed decisions with ease, leveraging the best of both worlds to navigate the markets effectively.
Conclusion:
In conclusion, Oster's Fair Index (OFI) represents a pioneering advancement in the realm of fundamental analysis, offering both sophisticated calculation methodologies and intuitive, user-friendly features. By marrying these elements with customizable parameters and intuitive visuals, OFI equips traders with a powerful tool for evaluating the fundamental valuation of stocks. Whether you're a seasoned investor or a novice trader, OFI offers invaluable insights that can inform and enrich your trading journey.
FCF / FFO / CFOA and dividends per shareThe indicator shows the Free Cashflow, Funds From Operations or Cash From Operating Activities per share and you can compare it to the dividends per share. You can see at a glance whether the dividends could be paid by one of this KPI. Please use the 12M time unit for the best result.

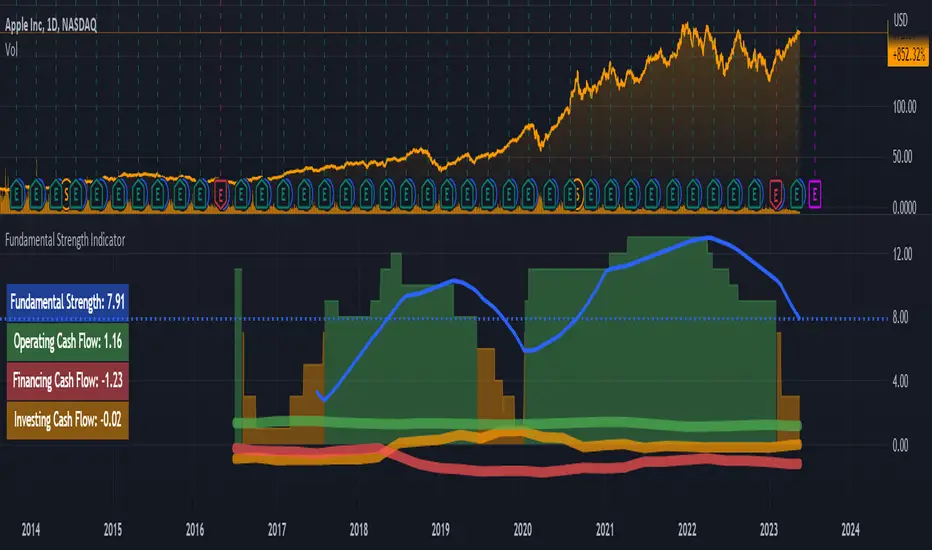
Fundamental Strength IndicatorName of the indicator: Fundamental Strength Indicator
A brief description of the indicator:
Using this indicator, you can evaluate a company in terms of the strength of its financial performance and see how that score has changed over time.
The background to the creation of the indicator:
The main idea that inspired me to create this indicator is: " Even if you buy just 1 share of a company, treat it like buying the whole business ". However, when I need to evaluate the business of thousands of public companies traded on exchanges, there is an objective difficulty: it is very time-consuming. To solve this problem, I had to create a scoring system of the fundamental analysis of the company, embodied in this indicator.
What the indicator looks like:
- First, it is a Histogram with bars of three colors: green, orange, and red. The width of the histogram depends on the depth of data from the company statements. The more historical data, the wider the histogram over time.
The green color of the bars means that the company has been showing excellent financial results by the sum of the factors in that time period. According to my terminology, the company has a " strong foundation " during this period. Green corresponds to values between 8 and 15 (where 15 is the maximum possible positive value on the sum of the factors).
The orange color of the bars means that according to the sum of factors during this period the company demonstrated mediocre financial results, i.e. it has a " mediocre foundation ". Orange color corresponds to values from 1 to 7.
The red color of the bars means that according to the sum of factors in this period of time, the company demonstrated weak financial results, i.e. it has a " weak foundation ". The red color corresponds to values from -15 to 0 (where -15 is the maximum possible negative value on the sum of factors).
- Second, this is the Blue Line , which is the moving average of the Histogram bars over the last year (*). Averaging over the year is necessary in order to obtain a weighted estimate that is not subject to medium-term fluctuations. It is by the last value of the blue line that the actual Fundamental Strength of the company is determined.
(*) The last year means the last 252 trading days, including the current trading day.
- Third, these are operating, investing, and financing Cash Flows expressed in Diluted net income. These flows look like thick green, orange, and red lines, respectively.
- Fourth, this is the Table on the left, which shows the latest actual value of the Fundamental Strength and Cash Flows.
Indicator settings:
In the indicator settings, I can disable the visibility of the Histogram, Blue Line, Cash Flows (each separately), and Table. It helps to study each of the parameters separately. It is also possible to change the color, transparency, and thickness of lines.
Mandatory requirements for using the indicator:
- works only on a daily timeframe;
- only applies to shares of public companies;
- company financial statements for the last 4 quarters and more are required;
- it is necessary to have the data from the Balance sheet, Income statement, and Cash flow statement, required for the calculation.
If at least one component required for calculating the Fundamental Strength is missing, the message " no data to calculate the Fundamental Strength correctly " is displayed. In the same case, but for the operating cash flow, the message " no data to calculate the Operating Cash Flow correctly " is shown, and similarly for other flows.
What is the value of the Fundamental Strength Indicator:
- allows for a quantitative assessment of a company's financial performance in points (from -15 to 15 points);
- allows you to visually track how the company's financial performance has changed (positively/negatively) over time;
- allows to visually trace the movement of main cash flows over time;
- speeds up the process of selecting companies for your shortlist (if you are focused on financial results when selecting companies);
- allows you to protect yourself from investing in companies with weak and mediocre fundamentals.
Indicator calculation methodology:
Guided by the "Treat stock investments as buying the whole business" approach, you can imagine what kind of business an investor is interested in owning and simultaneously determine the input parameters for calculating the indicator.
(!) Here it is important to emphasize that the idea of a benchmark business for investment is a subjective notion, so be sure to check whether it coincides with your own opinion.
For me, a benchmark business is:
- A business that operates efficiently without diminishing the return on shareholders' investment. To assess the efficiency and profitability of a business, I use the following financial ratios (*): Diluted EPS and Return on Equity (ROE). The first two parameters for calculating the indicator are there.
- A business that scales sales and optimizes its costs. From this point of view, the following financial ratios are suitable: Gross margin, Operating expense ratio, and Total revenue. Plus three other metrics.
- A business that turns goods/services into cash quickly and does not fall behind on payments to suppliers. The following financial ratios will fit here: Days payable, Days sales outstanding, and Inventory to revenue ratio. These are three more metrics.
- A business that does not resort to significant accounts payable and shows financial strength. Here I use the following financial ratios: Current ratio, Interest coverage, and Debt to revenue ratio. These are the last three parameters.
(*) If you want to learn more about these financial ratios, I suggest reading my two articles on TradingView:
Financial ratios: digesting them together
What can financial ratios tell us?
Next, each of the parameters is assigned a certain number of points based on its last value or the position of that value relative to the annual maximum and minimum.
For example, if the Current ratio:
- greater than or equal to 2 (+1 point);
- less than or equal to 1 (-1 point);
- more than 1 but less than 2 (0 points).
Or for example, if Diluted EPS:
- near or above the annual high (+2 points);
- near the annual minimum and below (-2 points);
- between the annual maximum and minimum (0 points).
And so on with each of the parameters.
As a result, the maximum number of points a company can score is 15 points. The minimum number of points a company can score is -15 points. These levels are marked with horizontal dotted lines: the green line is for the maximum value, and the red line is for the minimum.
I track the number of points for each day of a company's life on a three-color Histogram. The resulting average value for the last year is on the Blue Line. For me, it is the last value of the Blue Line that determines - this is the actual Fundamental Strength of the company.
The business valuation model I created is more suitable for companies that produce goods or services, and where tangible assets play a significant role in the business. For example, when analyzing companies in the financial sector, you may see the message "no data to calculate the Fundamental Strength correctly". Many of them may simply be missing data that is used as input for the calculation: Inventory to revenue ratio, Days sales outstanding, etc.
Examples:
Below I will evaluate various companies using the Fundamental Strength Indicator.
Tesla, Inc.
The indicator shows that since 2020, Tesla Inc. has been steadily increasing its Fundamental Strength (from 3.27 in Q1 2020 to 12.79 in Q1 2023). This is noticeable both by the color change of the Histogram from orange to green and by the rising Blue Line. If you look in detail at what has been happening with the financials during this time, it's clear what meaningful work the company has done. Revenues have almost quadrupled. Earnings per share have increased 134 times. At the same time, total debt to revenue fell almost 10 times.
Keurig Dr Pepper Inc.
The company, formed in 2018 by the merger of Keurig Green Mountain and Dr Pepper Snapple Group, has failed to deliver outstanding financial results, causing its Fundamental Strength to fall from 4.63 in Q1 2018 to -0.53 in Q1 2023. During this period, the drop in diluted earnings per share was accompanied by higher debt and deteriorating liquidity.
Costco Wholesale Corporation
Wholesaler Costco has been surprisingly stable in its financial performance and with steady growth in both earnings and revenue. This is the reason why the Histogram bars are exceptionally green throughout the calculation of the indicator. The Fundamental Strength has not changed in three years and is high at 11 points.
As an additional filter, for example, when comparing two companies where all other conditions are equal - I use the dynamics of Cash Flows expressed in Diluted net income (*). These are the thick green, orange, and red lines over the Histogram.
Why do I use income as a unit of measure of Cash Flows? Because it is a good way to make the scale of indicator values the same for companies from different countries, with different currencies. It also allows you to use a single value scale for both Cash Flows and Fundamental Strength.
(*) If you want to learn more about Cash Flows, I suggest reading my two articles on TradingView:
Cash flow statement or Three great rivers
Cash flow vibrations
So, an additional filter shows the dynamics of Cash Flows over time.
To interpret the dynamics of Cash Flows, I pay attention to the following patterns:
- How the cash flows are positioned in relation to each other;
- In which zone each of the cash flows is located - in the positive or negative;
- What is the trend of each of the cash flows;
- How volatile each of the cash flows is.
As an example, let's look at several companies in order to interpret the dynamics of their Cash Flows.
John B. Sanfilippo & Son, Inc.
This is the most ideal situation for me: operating cash flow (green line) is above the other cash flows, investment cash flow (orange line) is near zero and practically unchanged, and financial cash flow (red line) is consistently below zero. This picture shows that the company lives off its operating cash flow, does not increase its debt, does not spend a substantial amount of money on expensive purchases, and retains (does not sell off) assets.
Parker Hannifin Corporation
With stable operating cash flow (green line), the company implements investment programs by raising additional funding. This is noticeable due to an increase in financial cash flow (red line) and a simultaneous decrease in investment cash flow (orange line) with a significant deepening into negative areas. Apparently, there is not enough operating cash flow to realize the planned investments. One has to wonder how sustainable a company can be if it invests in its development using borrowed funds without a subsequent increase in operating cash flow.
Schlumberger N. V.
The chaotic intertwining of cash flows outside of the Fundamental Strength range (-15 to 15) is indicative of the company's rich life, but to me, it is an indicator of high riskiness of its actions. And as we can see, Fundamental Strength has only begun to strengthen in the last year, when the external appearance of cash flow has normalized.
Risk disclaimer:
When working with the Fundamental Strength Indicator and the additional filter in the form of Cash Flows, you should understand that the publication of the Balance sheet, Income statement, and Cash flow statement takes place sometime after the end of the financial quarter. This means that new relevant data for the calculation will only appear after the publication of the new statements. In this regard, there may be a significant change in the values of the Indicator after the publication of new statements. The magnitude of this change will depend both on the content of the new statements and on the number of days between the end of the financial quarter and the publication date of the statements. Until the date of publication of the new statements, the latest relevant data will be used for calculations.
I would like to draw your attention to the fact that the calculation of Fundamental Strength and Cash Flows requires the availability of data for all parameters of the valuation model . It uses data that is exclusively available on TradingView (there is no reconciliation with other sources). If at least one parameter is missing, I switch to another company's analysis to continue using the indicator.
Thus, the Fundamental Strength Indicator and an additional filter in the form of Cash Flows make it possible to evaluate the financial results of the company based on the available data and the methodology I created. A simple visualization in the form of a three-color Histogram, a Blue line, and three thick Cash Flow lines significantly reduces the time for selecting fundamentally strong companies that fit the criteria of the selected model. However, this Indicator and/or its description and/or examples cannot be used as the sole reason for buying or selling stocks or for any other action or inaction related to stocks.
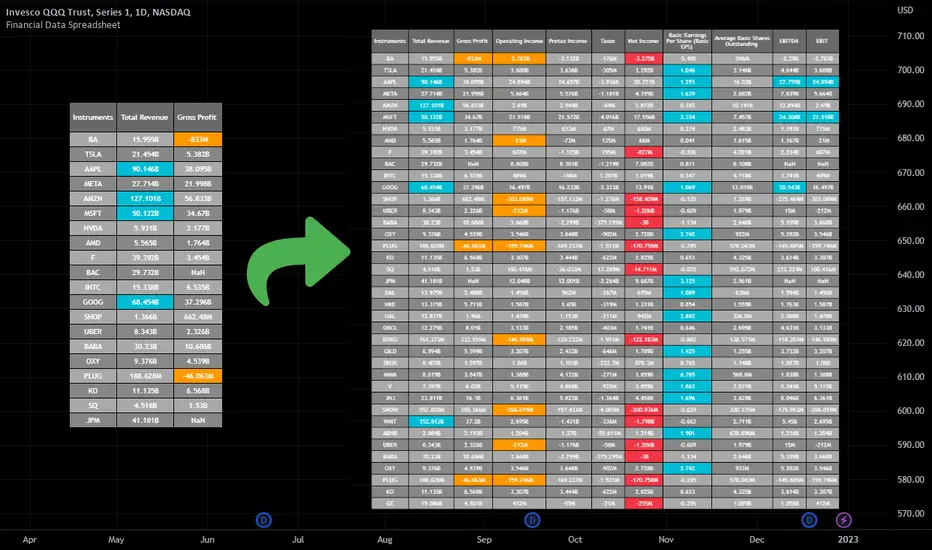
Financial Data Spreadsheet [By MUQWISHI]The Financial Data Spreadsheet indicator displays tables in the form of a spreadsheet containing a set of selected financial performances of a company within the most recent reported period. Analyzing Financial data is one of the classic methods to evaluate whether the company’s stock price is overvalued or undervalued based on its income statement, balance sheet, and cash flow statement. This indicator might be practical to investors to collect needed data of a company to analyze and compare it with other companies on a TradingView chart or print it in spreadsheet form.
█ OVERVIEW
█ BEST PRACTICES
Due to strict limitations on calling request.financial() function, I tried to develop the table with the best ways to be more dynamic to move and the ability to join multiple tables into a spreadsheet. Users can add up to 20 instruments and 2 financial metrics per table. However, it’s possible to add many tables with other financial metrics, then connect them to the main table.
Credits: The idea of joining multiple tables inspired by @QuantNomad Screener for 40+ instruments
█ INDICATOR SETTINGS
1- Moving Table toward right-left up-down from its origin.
2- Hiding Column Title checkmark. Useful for adding a joined table underneath with additional instruments.
3- Hiding Instruments Title checkmark. Useful for adding a joined table on the right with other financial metrics.
4- Shade Alternate Rows checkmark. I believe it’ll make the table easier to read.
5- Selecting Financial Period. (Year, Quarter).
6- Entering a currency.
7- Choosing a financial ID for each column. There’re over 200 financial IDs. Source: What financial data is available in Pine? — TradingView
8- Optional to highlight values in between.
9- Entering the ticker’s symbol with the ability to activate/deactivate.
█ TIP
For best technical performance, use the indicator in a 1D timeframe.
Please let me know if you have any questions.
Thank you.
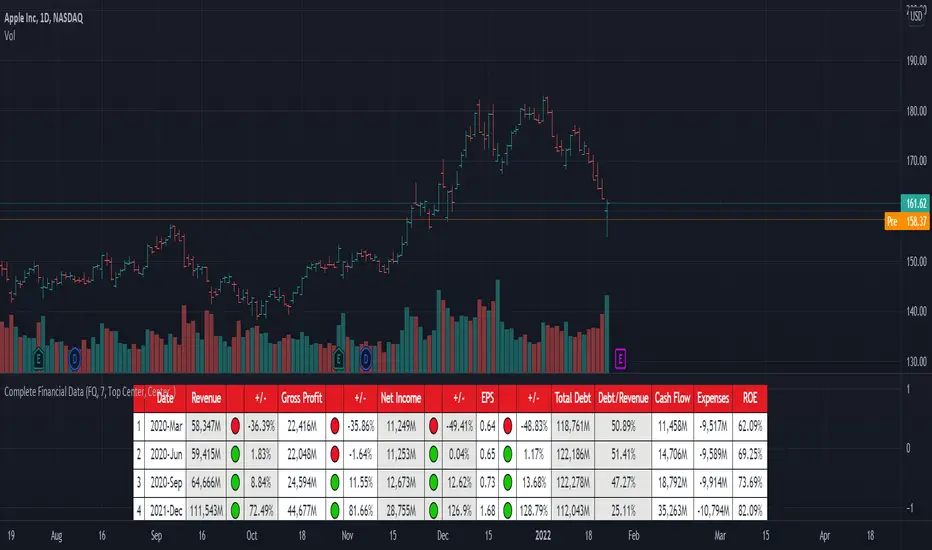
[TG] Complete Financial DataHISTORY & CREDITS
Complete Financial Data is basic, yet very effective tool, that will show the most important information from the company's latest financial statements at a glance.
WHAT IT DOES
The table is designed to show comprehensive financial data about the selected ticker.
Revenue - often referred to as sales or the top line, is the money received from normal business operations.
Gross profit , also called gross income, is calculated by subtracting the cost of goods sold from revenue.
Net income , also called net earnings, is calculated as sales minus cost of goods sold, selling, general and administrative expenses, operating expenses, depreciation, interest, taxes, and other expenses.
Earnings per share (EPS) is calculated as a company's profit divided by the outstanding shares of its common stock. The resulting number serves as an indicator of a company's profitability.
Total debt includes long-term liabilities, such as mortgages and other loans that do not mature for several years, as well as short-term obligations, including loan payments and accounts payable balances.
The debt-to-revenue ratio is a financial measure that compares a company's monthly debt payment to its monthly gross income.
The term cash flow refers to the net amount of cash and cash equivalents being transferred in and out of a company. Cash received represents inflows, while money spent represents outflows.
An expense is the cost of operations that a company incurs to generate revenue. As the popular saying goes, “it costs money to make money.”
Return on equity (ROE) is a measure of financial performance calculated by dividing net income by shareholders' equity.
HOW TO USE IT
Even if you are entirely a technical analyst, it's always a good practice to take a look at the company's fundamentals, in order to understand more about the heath of the business. Look for companies that beat expectations and show positive growth numbers.
Oborot V.3 by SavosRUUse this indicator to view changes of the "money flow turnover" = SMA(Vol*Price) by two any different timeframes.
Preferentially times is:
- DAILY
- CURRENT timeframe of the chart
But You can make any settings by your choice.

TradiKator F2 Cash%Mkt CapTradiKator F2(Finance series 2nd) Cash%Mkt Cap
This shows free cash flow to market cap ratio.

Funamental and financialsEarnings and Quarterly reporting and fundamental data at a glance.
A study of the financial data available by the "financial" functions in pinescript/tradingview
As far as I know, this script is unique. I found very few public examples of scripts using the fundamental data. and none that attempt to make the data available in a useful form
as an indicator / chart data. The only fitting category when publishing would be "trend analysis" We are going to look at the trend of the quarterly reports.
The intent is to create an indicator that instantly show the financial health of a company, and the trends in debt, cash and earnings
Normal settings displays all information on a per share basis, and should be viewed on a Daily chart
Percentage of market valuation can be used to compare fundamentals to current share price.
And actual to show the full numbers for verification with quarterly reporting and debuggging (actual is divided by 1.000.000 to keep numbers readable)
Credits to research study by Alex Orekhov (everget) for the Symbol Info Helper script
without it this would still be an unpublished mess, the use of textboxes allow me to remove many squiggly plot lines of fundamental data
Known problems and annoyances
1. Takes a long time to load. probably the amount of financial calls is the culprit. AFAIK not something i can to anything about in the script.
2. Textboxes crowd each other. dirty fix with hardcoded offsets. perhaps a few label offset options in the settings would do?
3. Only a faint idea of how to put text boxes on every quarter. Need time... (pun intended)
Have fun, and if you make significant improvements on this, please publish, or atleast leave a comment or message so I can consider adding it to this script.
© sjakk 2020-june-08

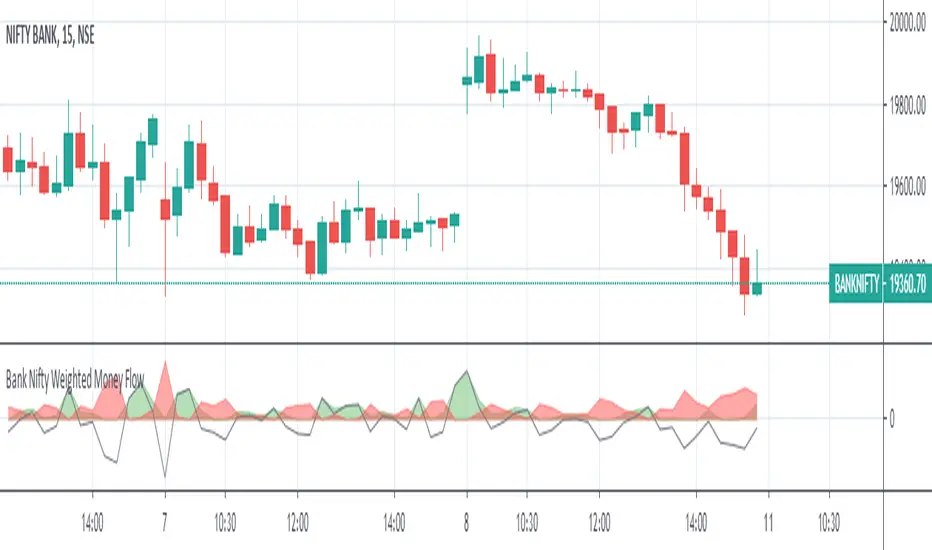
Bank Nifty Weighted Money FlowThe indicator comprises of 2 areas ( one in green and another in red ) that depict the money flowing in and out the underlying 12 banks under BANK NIFTY index
The money flowing in and flowing out is calculated by identifying the buying pressure and selling pressure of each of 12 underlying banks within a 15 minute period ( which is internally further broken down by 15 one minute candles ), there by identifying the buy volume and sell volume multiplied by the price of the stock for the given minute aggregated for 15 minutes
The derived value for each bank is further weighted as per their weight in the index ( as of May 2nd 2020 ) and then summed up separately for both money flowing in and flowing out and plotted which shall help traders take decision based on the magnitude of money flowing in and out ( the weights shall be updated as and when the same changes in the index calculations )
The green color area represents the money flown in and the red color area represents the money that has flown out
A gradually increasing green area along with the decrease in the red area can be considered as the market is more into buying and less into selling and vice versa ( this can be observed in the chart before the rally begins , there should be an increasing green area which could potentially signifies money has started to flow in )
An equal or almost equal areas could signify a sideways market and the black line moving across shows the difference of money flowing and flowing out
Comments and feedback are welcome
Should you have any doubts or wish to access the script then please feel free to DM me.
***** The indicator works only in 15 minutes time frame *****
CashflowCashflow analysis is a current measure of cash flowing into and out of a commodity. This indicator will color sell signals as red and buy as green. Market noise is yellow. Change the moving average of the Cashflow indicator to color your desired buy and sell triggers.
