PROTECTED SOURCE SCRIPT
Atualizado Support/Resistance Levels

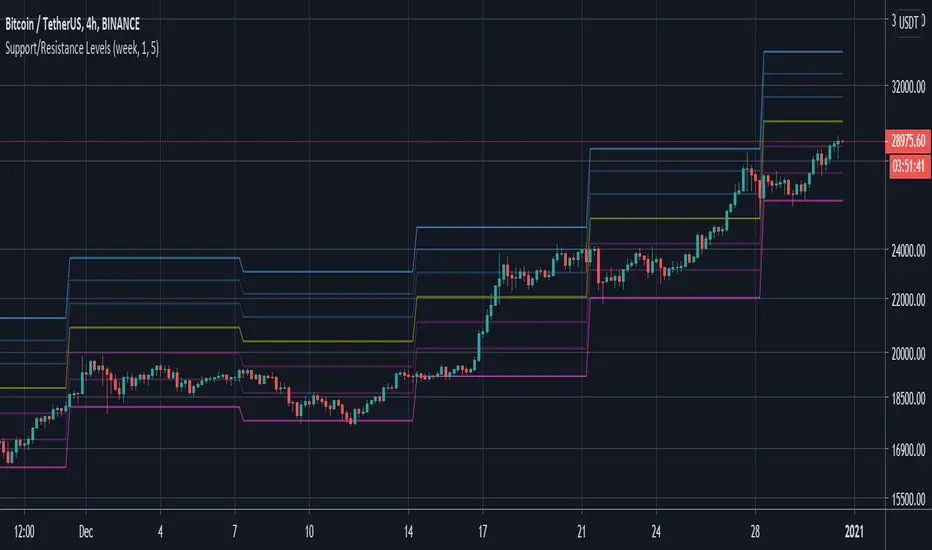
This script will show lines of support/resistance in each period you set (default is 1week). It shows 6 levels with the difference you can set too (default is 5%). The reason why I set default as 5% because as I notice the market will get bounced when it reach 5% up/down and hold that level for some time before it start moving up/down again. Hope this script will help you decide whether it's time to buy/sell when it reached the levels. Thank you.
Notas de Lançamento
Make it cleaner with lesser lines and better coloringsNotas de Lançamento
- Transparent level for default has changed- Mainly for updating the chart screenshot with a clean chart
Script protegido
Esse script é publicada como código fechado. No entanto, você pode gerenciar suas escolhas de bate-papo. Por favor, abra suas Configurações do perfil
Aviso legal
As informações e publicações não se destinam a ser, e não constituem, conselhos ou recomendações financeiras, de investimento, comerciais ou de outro tipo fornecidos ou endossados pela TradingView. Leia mais nos Termos de Uso.