OPEN-SOURCE SCRIPT
ChartRage - ELMA
ELMA - Exponential Logarithmic Moving Average
This is a new kind of moving average that is using exponential normalization of a logarithmic formula. The exponential function is used to average the weight on the moving average while the logarithmic function is used to calculate the overall price effect.
Features and Settings:
◻️ Following rate of change instead of absolute levels
◻️ Choose input source of the data
◻️ Real time signals through price interaction
◻️ Change ELMA length
◻️ Change the exponential decay rate
◻️ Customize base color and signal color
Equation of the ELMA:

This formula calculates a weighted average of the logarithm of prices, where more recent prices have a higher weight. The result is then exponentiated to return the ELMA value. This approach emphasizes the relative changes in price, making the ELMA sensitive to the % rate of change rather than absolute price levels. The decay rate can be adjusted in the settings.
Comparison EMA vs ELMA:

In this image we see the differences to the Exponential Moving Average.
Price Interaction and earlier Signals:

In this image we have added the bars, so we can see that the ELMA provides different signals of resistance and support zones and highlights them, by changing to the color yellow, when prices interact with the ELMA.
Strategy by trading Support and Resistance Zones:

The ELMA helps to evaluate trends and find entry points in bullish market conditions, and exit points in bearish conditions. When prices drop below the ELMA in a bull market, it is considered a buying signal. Conversely, in a bear market, it serves as an exit signal when prices trade above the ELMA.
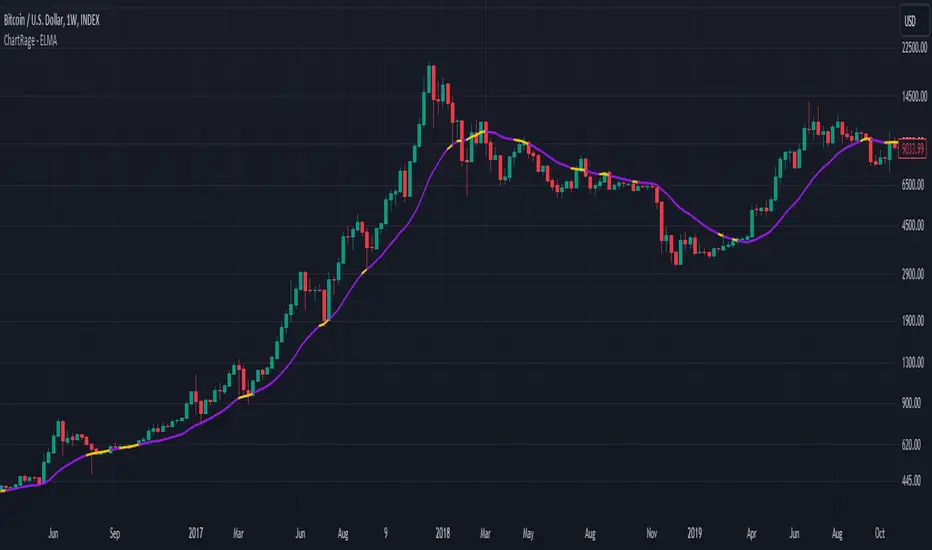
Volatile Markets:

The ELMA works on all timeframes and markets. In this example we used the default value for Bitcoin. The ELMA clearly shows support and resistance zones. Depending on the asset, the length and the decay rate should be adjusted to provide the best results.
Real Time Signals:

Signals occur not after a candle closes but when price interacts with the ELMA level, providing real time signals by shifting color. (default = yellow)
Disclaimer* All analyses, charts, scripts, strategies, ideas, or indicators developed by us are provided for informational and educational purposes only. We do not guarantee any future results based on the use of these tools or past data. Users should trade at their own risk.
This work is licensed under Attribution-NonCommercial-ShareAlike 4.0 International
https://creativecommons.org/licenses/by-nc-sa/4.0/
This is a new kind of moving average that is using exponential normalization of a logarithmic formula. The exponential function is used to average the weight on the moving average while the logarithmic function is used to calculate the overall price effect.
Features and Settings:
◻️ Following rate of change instead of absolute levels
◻️ Choose input source of the data
◻️ Real time signals through price interaction
◻️ Change ELMA length
◻️ Change the exponential decay rate
◻️ Customize base color and signal color
Equation of the ELMA:
This formula calculates a weighted average of the logarithm of prices, where more recent prices have a higher weight. The result is then exponentiated to return the ELMA value. This approach emphasizes the relative changes in price, making the ELMA sensitive to the % rate of change rather than absolute price levels. The decay rate can be adjusted in the settings.
Comparison EMA vs ELMA:
In this image we see the differences to the Exponential Moving Average.
Price Interaction and earlier Signals:
In this image we have added the bars, so we can see that the ELMA provides different signals of resistance and support zones and highlights them, by changing to the color yellow, when prices interact with the ELMA.
Strategy by trading Support and Resistance Zones:
The ELMA helps to evaluate trends and find entry points in bullish market conditions, and exit points in bearish conditions. When prices drop below the ELMA in a bull market, it is considered a buying signal. Conversely, in a bear market, it serves as an exit signal when prices trade above the ELMA.
Volatile Markets:
The ELMA works on all timeframes and markets. In this example we used the default value for Bitcoin. The ELMA clearly shows support and resistance zones. Depending on the asset, the length and the decay rate should be adjusted to provide the best results.
Real Time Signals:
Signals occur not after a candle closes but when price interacts with the ELMA level, providing real time signals by shifting color. (default = yellow)
Disclaimer* All analyses, charts, scripts, strategies, ideas, or indicators developed by us are provided for informational and educational purposes only. We do not guarantee any future results based on the use of these tools or past data. Users should trade at their own risk.
This work is licensed under Attribution-NonCommercial-ShareAlike 4.0 International
https://creativecommons.org/licenses/by-nc-sa/4.0/
Script de código aberto
Em verdadeiro espírito do TradingView, o criador deste script o tornou de código aberto, para que os traders possam revisar e verificar sua funcionalidade. Parabéns ao autor! Embora você possa usá-lo gratuitamente, lembre-se de que a republicação do código está sujeita às nossas Regras da Casa.
Aviso legal
As informações e publicações não se destinam a ser, e não constituem, conselhos ou recomendações financeiras, de investimento, comerciais ou de outro tipo fornecidos ou endossados pela TradingView. Leia mais nos Termos de Uso.