OPEN-SOURCE SCRIPT
Double RSI
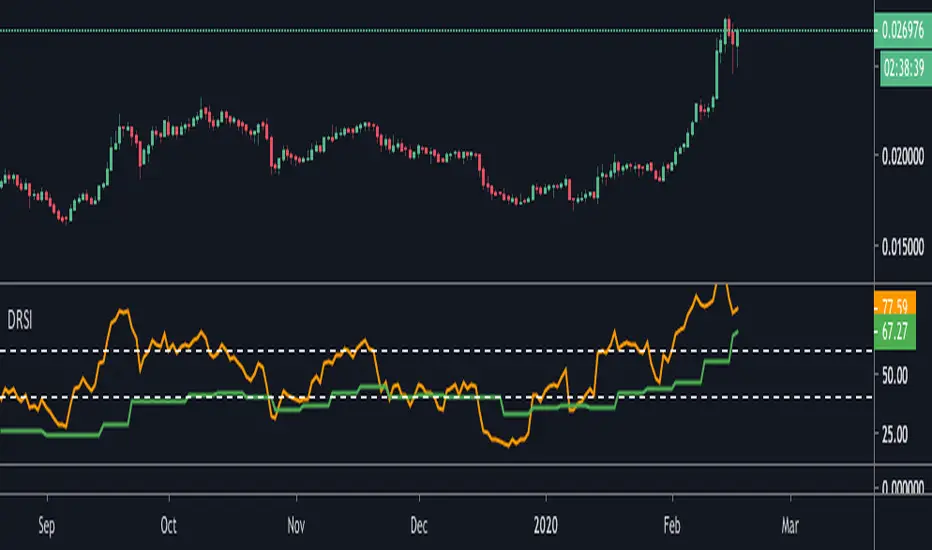
This is double RSI script which plots one time frame higher RSI along with the current time frame i.e
For Weekly chart it display Weekly and Monthly RSI
For Daily chart it display Daily and Weekly RSI
For Intraday chart it display Intraday and Daily RSI.
Usage:
If Daily RSI is above 60 and weekly above 40 and moving up then stock is in a good uptrend look for buying when Daily takes support at 60. Usually First test of Daily produces a good entry for subsequent entries probability decreases.
For Downtrend look for Daily RSI below 40 and weekly below 60.
Script de código aberto
Em verdadeiro espírito do TradingView, o criador deste script o tornou de código aberto, para que os traders possam revisar e verificar sua funcionalidade. Parabéns ao autor! Embora você possa usá-lo gratuitamente, lembre-se de que a republicação do código está sujeita às nossas Regras da Casa.
Aviso legal
As informações e publicações não se destinam a ser, e não constituem, conselhos ou recomendações financeiras, de investimento, comerciais ou de outro tipo fornecidos ou endossados pela TradingView. Leia mais nos Termos de Uso.