OPEN-SOURCE SCRIPT
Atualizado 3x Supertrend + EMA200 Signal Buy/Sell [nsen]

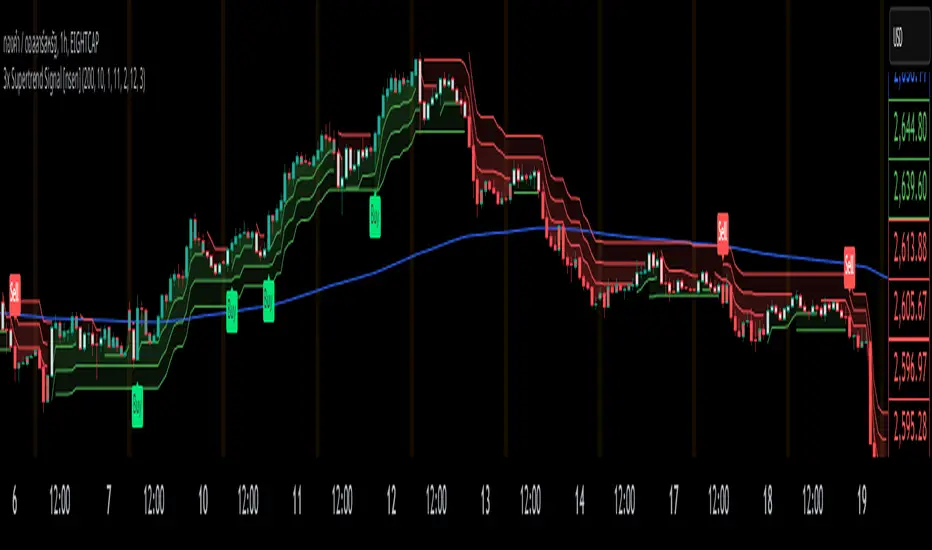
The indicator uses signals from three Supertrend lines to determine whether to trade Buy or Sell, with the assistance of a moving average for bias.
Buy/Sell signals are generated when the conditions are met:
A Buy signal is triggered when all three Supertrend lines indicate a bullish trend and are above the EMA.
A Sell signal is triggered when all three Supertrend lines indicate a bearish trend and are below the EMA.
Indicator ใช้สัญญาณจาก Supertrend ทั้งหมด 3 เส้น โดยใช้ในการกำหนดว่าจะเลือกเทรด Buy หรือ Sell โดยการใช้ moveing average เข้ามาช่วยในการ bias
แสดงสัญญาณ Buy/Sell เมื่อเข้าเงื่อนไข
- Supertrend ทั้ง 3 เส้นเป็นสัญญาณ Bullish และอยู่เหนือเส้น EMA จะเปิดสัญญาณ Buy
- Supertrend ทั้ง 3 เส้นเป็นสัญญาณ Bearish และอยู่ใต้เส้น EMA จะเปิดสัญญาณ Sell
Notas de Lançamento
Indicator Name: Multi-Supertrend with EMA ConfirmationConcept and Functionality
This indicator combines three Supertrend levels (Fast, Medium, Slow) with an Exponential Moving Average (EMA) to detect market trends and generate more reliable buy/sell signals.
• Supertrend Indicator is a trend-following tool that uses the Average True Range (ATR) to create dynamic support and resistance levels.
• EMA (Exponential Moving Average) acts as an additional trend filter to reduce false signals.
This indicator is designed to help traders identify market trends and precise entry points using a multi-timeframe confirmation approach.
===========================================
Calculation and Key Components
EMA (Exponential Moving Average)
• Uses a 200-period EMA as a dynamic support/resistance level.
• Price closing above the EMA suggests an uptrend.
• Price closing below the EMA suggests a downtrend.
Three Supertrend Levels
• Each Supertrend is calculated using different ATR lengths and factors (Fast, Medium, Slow).
• Helps detect trend direction and potential reversals.
Trend Identification
• Bullish Trend: All three Supertrend lines are in an uptrend, and price is above the EMA.
• Bearish Trend: All three Supertrend lines are in a downtrend, and price is below the EMA.
• Neutral Trend: When the Supertrend signals are mixed.
Candle Coloring for Trend Visualization
• Green: Strong uptrend (All three Supertrends are bullish).
• Red: Strong downtrend (All three Supertrends are bearish).
• Lighter colors: Transition phases.
Buy/Sell Signal Conditions
• Buy Signal:
- All three Supertrend lines are bullish.
- Price is above the EMA.
- Trend shift from bearish to bullish.
• Sell Signal:
- All three Supertrend lines are bearish.
- Price is below the EMA.
- Trend shift from bullish to bearish.
Alerts System
• The indicator includes built-in alerts when buy or sell signals are triggered based on the conditions above.
Script de código aberto
Em verdadeiro espírito do TradingView, o criador deste script o tornou de código aberto, para que os traders possam revisar e verificar sua funcionalidade. Parabéns ao autor! Embora você possa usá-lo gratuitamente, lembre-se de que a republicação do código está sujeita às nossas Regras da Casa.
Aviso legal
As informações e publicações não se destinam a ser, e não constituem, conselhos ou recomendações financeiras, de investimento, comerciais ou de outro tipo fornecidos ou endossados pela TradingView. Leia mais nos Termos de Uso.