OPEN-SOURCE SCRIPT
Atualizado EMA Levels, Multi-Timeframe
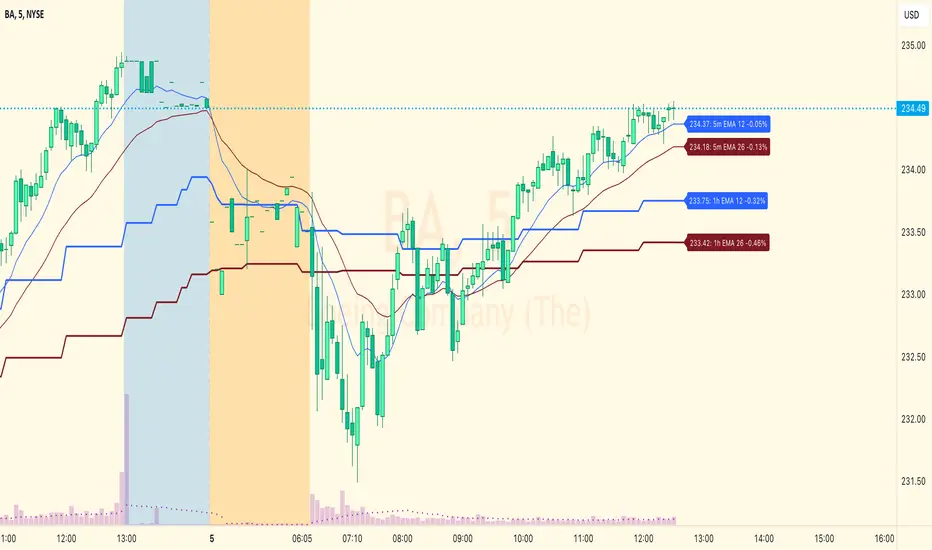
The exponential moving average (EMA) tracks price over time, giving more importance to recent price data than simple moving average (SMA). EMAs for larger timeframes are generally considered to be stronger supports/resistances for price to move through than smaller timeframes. This indicator allows you to specify two different EMA lengths that you want to track. Additionally, this indicator allows you to display not just the EMA levels of your currently viewed timeframe on the chart, but also shows the EMA levels of up to 4 different timeframes on the same chart. This allows you to quickly see if multiple EMA levels are aligning across different timeframes, which is an even stronger indication that price is going to meet support or resistance when it meets those levels on the chart. There are a lot of nice configuration options, like:
- Ability to customize the EMA lengths you want to track
- Style customization (color, thickness, size)
- Hide any timeframes/levels you aren't interested in
- Labels on the chart so you can tell which plots are the EMA levels
- Optionally display the plot as a horizontal line if all you care about is the EMA level right now
Notas de Lançamento
Modified script to optionally switch to simple moving averages instead of exponential moving averages. Changed all associated labels, etc. Notas de Lançamento
Overhaul of entire indicator that brings it up to date with the following improvements:- Fixed bug that caused lower timeframe MAs to calculate incorrectly when on the daily timeframe and above
- Improved performance (fewer request.security calls)
- Updated to use our standardized libraries
- Improved configuration & appearance
Notas de Lançamento
Code cleanupNotas de Lançamento
A couple of minor improvements:- Added smoother lines for higher timeframe plots with "Gaps" option.
- Added option to hide lower timeframe plots when on higher timeframe charts.
Notas de Lançamento
Bugfix: SMA levels were not calculating correctly.Script de código aberto
Em verdadeiro espírito do TradingView, o criador deste script o tornou de código aberto, para que os traders possam revisar e verificar sua funcionalidade. Parabéns ao autor! Embora você possa usá-lo gratuitamente, lembre-se de que a republicação do código está sujeita às nossas Regras da Casa.
I release TradingView indicators and libraries designed to make you a better trader. For detailed info about them, head over to improve.trading
Aviso legal
As informações e publicações não se destinam a ser, e não constituem, conselhos ou recomendações financeiras, de investimento, comerciais ou de outro tipo fornecidos ou endossados pela TradingView. Leia mais nos Termos de Uso.
Script de código aberto
Em verdadeiro espírito do TradingView, o criador deste script o tornou de código aberto, para que os traders possam revisar e verificar sua funcionalidade. Parabéns ao autor! Embora você possa usá-lo gratuitamente, lembre-se de que a republicação do código está sujeita às nossas Regras da Casa.
I release TradingView indicators and libraries designed to make you a better trader. For detailed info about them, head over to improve.trading
Aviso legal
As informações e publicações não se destinam a ser, e não constituem, conselhos ou recomendações financeiras, de investimento, comerciais ou de outro tipo fornecidos ou endossados pela TradingView. Leia mais nos Termos de Uso.