OPEN-SOURCE SCRIPT
VWMA Crosses
This is a simple tool that gives traders a simple visual representation of Volume-Weighted Moving Average ( VWMA ) crossovers that is pretty similar to the MACD . We don't typically trade solely based on the VWMA , but it is definitely one of our go-to tools when combining multiple indicators.
When trading with VWMA's, it is common to enter a position when the fast VWMA crosses over the slow VWMA . In other words, the fast VWMA was previously less than the slow VWMA and is now greater in value than the slow VWMA . Conversely, traders often exit their positions when the fast VWMA crosses under the slow VWMA .
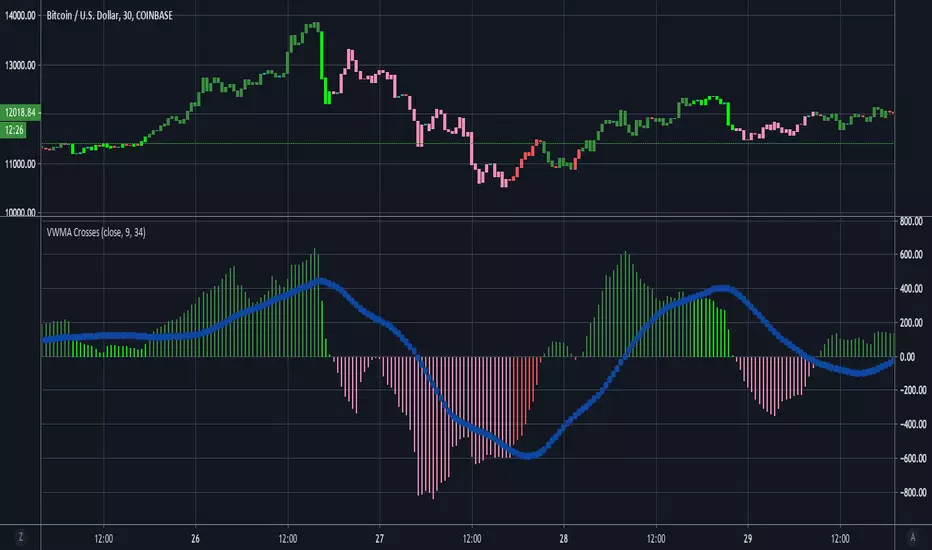
This tool plots the absolute value of the difference between the fast and slow VWMA's as a histogram. When the difference between the fast and slow VWMA's is greater than zero (meaning fast > slow), then the bars are green. The bars then turn red when the fast VWMA is less than the slow VWMA . The blue circle-line is a Simple Moving Average of the difference between the two lines.
Here's a quick guide to interpreting the chart:
if (fast VWMA > slow VWMA ) and (difference < sma of differences)
then color = lime green
if (fast VWMA > slow VWMA ) and (difference > sma of differences)
then color = dark green
if (fast VWMA < slow VWMA ) and (difference < sma of differences)
then color = light red
if (fast VWMA < slow VWMA ) and (difference > sma of differences)
then color = dark red
~Happy Trading~
When trading with VWMA's, it is common to enter a position when the fast VWMA crosses over the slow VWMA . In other words, the fast VWMA was previously less than the slow VWMA and is now greater in value than the slow VWMA . Conversely, traders often exit their positions when the fast VWMA crosses under the slow VWMA .
This tool plots the absolute value of the difference between the fast and slow VWMA's as a histogram. When the difference between the fast and slow VWMA's is greater than zero (meaning fast > slow), then the bars are green. The bars then turn red when the fast VWMA is less than the slow VWMA . The blue circle-line is a Simple Moving Average of the difference between the two lines.
Here's a quick guide to interpreting the chart:
if (fast VWMA > slow VWMA ) and (difference < sma of differences)
then color = lime green
if (fast VWMA > slow VWMA ) and (difference > sma of differences)
then color = dark green
if (fast VWMA < slow VWMA ) and (difference < sma of differences)
then color = light red
if (fast VWMA < slow VWMA ) and (difference > sma of differences)
then color = dark red
~Happy Trading~
Script de código aberto
Em verdadeiro espírito do TradingView, o criador deste script o tornou de código aberto, para que os traders possam revisar e verificar sua funcionalidade. Parabéns ao autor! Embora você possa usá-lo gratuitamente, lembre-se de que a republicação do código está sujeita às nossas Regras da Casa.
-Profit Programmers
profitprogrammer.com
profitprogrammer.com
Aviso legal
As informações e publicações não se destinam a ser, e não constituem, conselhos ou recomendações financeiras, de investimento, comerciais ou de outro tipo fornecidos ou endossados pela TradingView. Leia mais nos Termos de Uso.