PROTECTED SOURCE SCRIPT
ATR vs Gain/Loss Ratio_By Rao_GS (with TR (RSI) Confirmation)
Description: ATR vs Gain/Loss Ratio_By Rao_GS (with TR (RSI) Confirmation)
🔍 Overview
The ATR vs Gain/Loss Ratio indicator by Rao_GS is a volatility-driven momentum tool designed to detect strong directional shifts confirmed by the relationship between Average True Range (ATR) and the average Gain/Loss ratios.
It helps identify points where volatility expansion aligns with momentum reversal — providing high-probability BUY and SELL zones.
⚙️ Core Logic
ATR (Average True Range):
Measures volatility using the range between high and low prices.
Gain/Loss Averages:
Calculates the average of positive (gain) and negative (loss) movements over a user-defined period.
ATR Ratios:
ATR / Avg Gain and ATR / Avg Loss create two oscillating curves.
Crossover Detection:
Buy Signal → When the ATR/Gain ratio crosses above the ATR/Loss ratio during high volatility.
Sell Signal → When the ATR/Gain ratio crosses below the ATR/Loss ratio during high volatility.
Volatility Confirmation (TR Filter):
The True Range (TR) must be at least a certain multiple of ATR (default 1.1×) to confirm genuine market momentum.
🎯 Signals
🟢 BUY:
Occurs when bullish momentum strengthens (ATR/Gain > ATR/Loss) and volatility confirms the move.
🔴 SELL:
Occurs when bearish momentum dominates (ATR/Loss > ATR/Gain) under heightened volatility.
Background color highlights active signal zones:
Light Green → Confirmed BUY zone
Light Red → Confirmed SELL zone
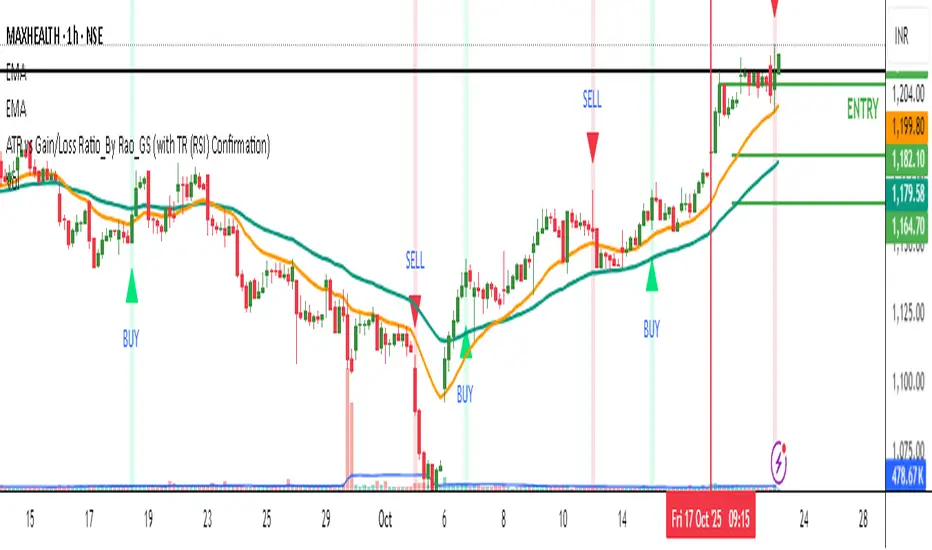
📈 Visualization
Lime Line: ATR/Gain ratio
Red Line: ATR/Loss ratio
Triangles:
🟢 Up triangle → Buy
🔴 Down triangle → Sell
This design allows traders to see both volatility shifts and momentum transitions together on a single overlay chart.
🔍 Overview
The ATR vs Gain/Loss Ratio indicator by Rao_GS is a volatility-driven momentum tool designed to detect strong directional shifts confirmed by the relationship between Average True Range (ATR) and the average Gain/Loss ratios.
It helps identify points where volatility expansion aligns with momentum reversal — providing high-probability BUY and SELL zones.
⚙️ Core Logic
ATR (Average True Range):
Measures volatility using the range between high and low prices.
Gain/Loss Averages:
Calculates the average of positive (gain) and negative (loss) movements over a user-defined period.
ATR Ratios:
ATR / Avg Gain and ATR / Avg Loss create two oscillating curves.
Crossover Detection:
Buy Signal → When the ATR/Gain ratio crosses above the ATR/Loss ratio during high volatility.
Sell Signal → When the ATR/Gain ratio crosses below the ATR/Loss ratio during high volatility.
Volatility Confirmation (TR Filter):
The True Range (TR) must be at least a certain multiple of ATR (default 1.1×) to confirm genuine market momentum.
🎯 Signals
🟢 BUY:
Occurs when bullish momentum strengthens (ATR/Gain > ATR/Loss) and volatility confirms the move.
🔴 SELL:
Occurs when bearish momentum dominates (ATR/Loss > ATR/Gain) under heightened volatility.
Background color highlights active signal zones:
Light Green → Confirmed BUY zone
Light Red → Confirmed SELL zone
📈 Visualization
Lime Line: ATR/Gain ratio
Red Line: ATR/Loss ratio
Triangles:
🟢 Up triangle → Buy
🔴 Down triangle → Sell
This design allows traders to see both volatility shifts and momentum transitions together on a single overlay chart.
Script protegido
Esse script é publicada como código fechado. No entanto, você pode usar ele livremente e sem nenhuma limitação – saiba mais aqui.
Aviso legal
As informações e publicações não devem ser e não constituem conselhos ou recomendações financeiras, de investimento, de negociação ou de qualquer outro tipo, fornecidas ou endossadas pela TradingView. Leia mais em Termos de uso.