OPEN-SOURCE SCRIPT
JADUGAAR_GORACHAND_V2
1. What is a Trendline?
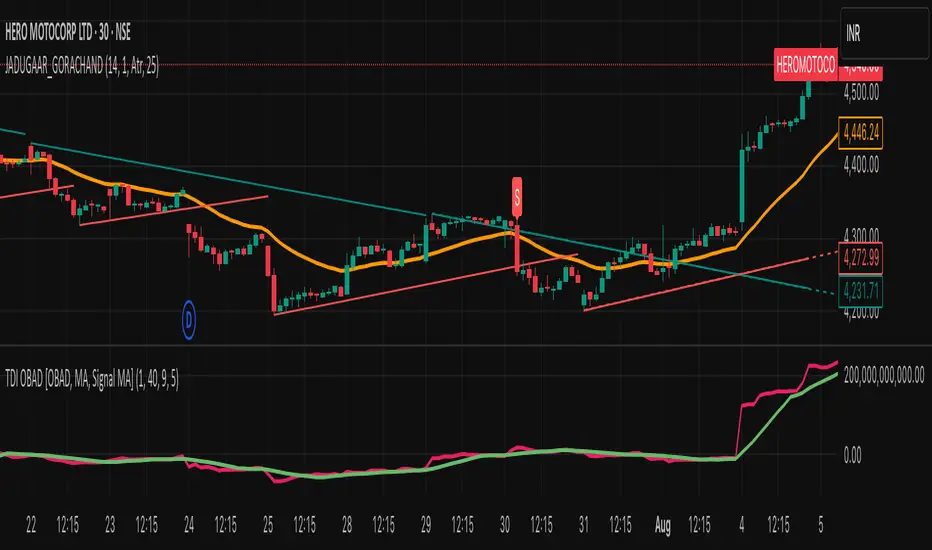
A trendline is a straight line drawn on a chart that connects two or more price points. It helps visualize the direction and strength of a trend — uptrend, downtrend, or sideways.
🔼 2. Uptrend Line
An uptrend line connects higher lows. It acts as a support level, suggesting that buyers are in control. Price tends to bounce upward off this line during a bullish trend.
🔽 3. Downtrend Line
A downtrend line connects lower highs. It acts as a resistance level, indicating that sellers dominate. Price tends to fall after touching this line in a bearish trend.
🔄 4. Trendline Breaks
When price breaks a trendline, it may signal a potential trend reversal or trend weakening. Traders often use this for entry or exit signals.
📊 5. Trendline Validity
A trendline is more reliable when:
It touches 3 or more points
It's drawn over a longer time frame
There's strong volume on the breakout
Script de código aberto
Em verdadeiro espírito do TradingView, o criador deste script o tornou de código aberto, para que os traders possam revisar e verificar sua funcionalidade. Parabéns ao autor! Embora você possa usá-lo gratuitamente, lembre-se de que a republicação do código está sujeita às nossas Regras da Casa.
Aviso legal
As informações e publicações não se destinam a ser, e não constituem, conselhos ou recomendações financeiras, de investimento, comerciais ou de outro tipo fornecidos ou endossados pela TradingView. Leia mais nos Termos de Uso.