OPEN-SOURCE SCRIPT
RSI Oversold/Overbought Indicator
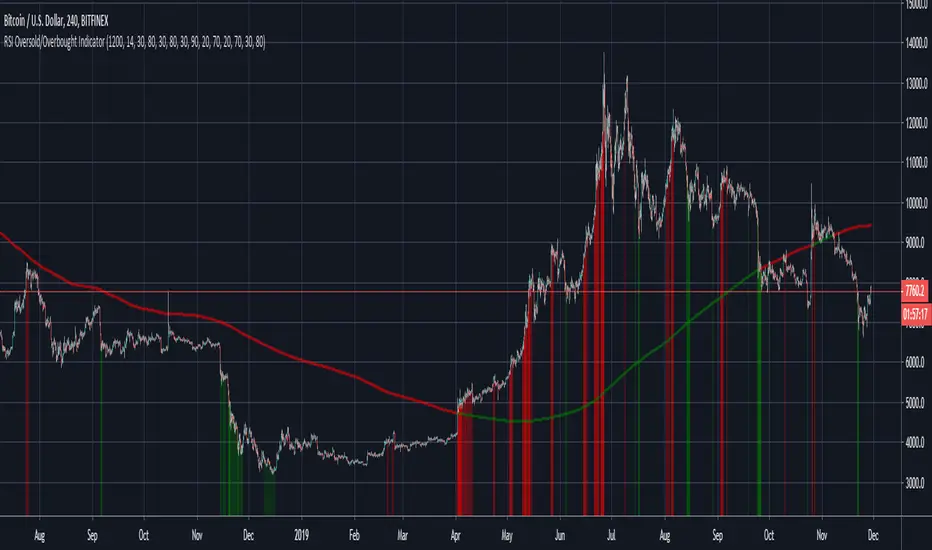
This is a very simple but quite powerful indicator which looks at the RSI simultaneously over the 4h, Daily and Weekly timeframes, and places bands on the chart when one or more timeframes move into oversold/overbought territory. For further filtering I use the 200 day SMA to determine if we are in a Bull or Bear market, which puts a bias on the RSI (30/80 in a Bull market and 20/70 in a Bear market).
The deeper the colour, the more oversold the market is. The weekly RSI can be used as an early warning sign, with the Daily/ 4h RSI useful to identify local peaks.
The deeper the colour, the more oversold the market is. The weekly RSI can be used as an early warning sign, with the Daily/ 4h RSI useful to identify local peaks.
Script de código aberto
Em verdadeiro espírito do TradingView, o criador deste script o tornou de código aberto, para que os traders possam revisar e verificar sua funcionalidade. Parabéns ao autor! Embora você possa usá-lo gratuitamente, lembre-se de que a republicação do código está sujeita às nossas Regras da Casa.
Aviso legal
As informações e publicações não se destinam a ser, e não constituem, conselhos ou recomendações financeiras, de investimento, comerciais ou de outro tipo fornecidos ou endossados pela TradingView. Leia mais nos Termos de Uso.