PROTECTED SOURCE SCRIPT
BB vs KC Visual Zones
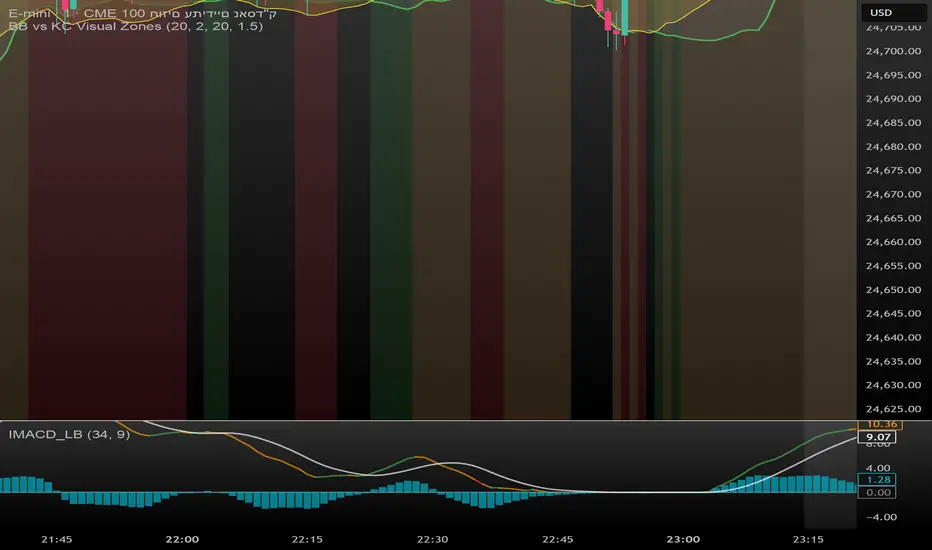
📌 BB vs KC Visual Zones
This script combines the power of two popular volatility indicators — Bollinger Bands (BB) and Keltner Channels (KC) — into one intuitive and visually enhanced tool. It is designed to help traders identify high-volatility moments in the market, often signaling potential breakouts.
✅ What’s Included:
Bollinger Bands based on SMA and standard deviation.
Keltner Channels based on EMA and ATR.
Color-coded highlights for quick visual analysis:
Upper BB in bold red when it crosses above the upper KC.
Lower BB in bold green when it drops below the lower KC.
Background color dynamically adjusts based on breakout conditions.
Clear visualization of Squeeze and Breakout scenarios directly on the main chart.
🎯 Best Used For:
Spotting potential breakout zones when BB expands beyond KC.
Understanding underlying market volatility conditions.
Using as a standalone volatility filter, or integrating into broader trading systems.
Script protegido
Esse script é publicada como código fechado. No entanto, você pode gerenciar suas escolhas de bate-papo. Por favor, abra suas Configurações do perfil
NinjADeviL
Aviso legal
As informações e publicações não se destinam a ser, e não constituem, conselhos ou recomendações financeiras, de investimento, comerciais ou de outro tipo fornecidos ou endossados pela TradingView. Leia mais nos Termos de Uso.