OPEN-SOURCE SCRIPT
PI indicator
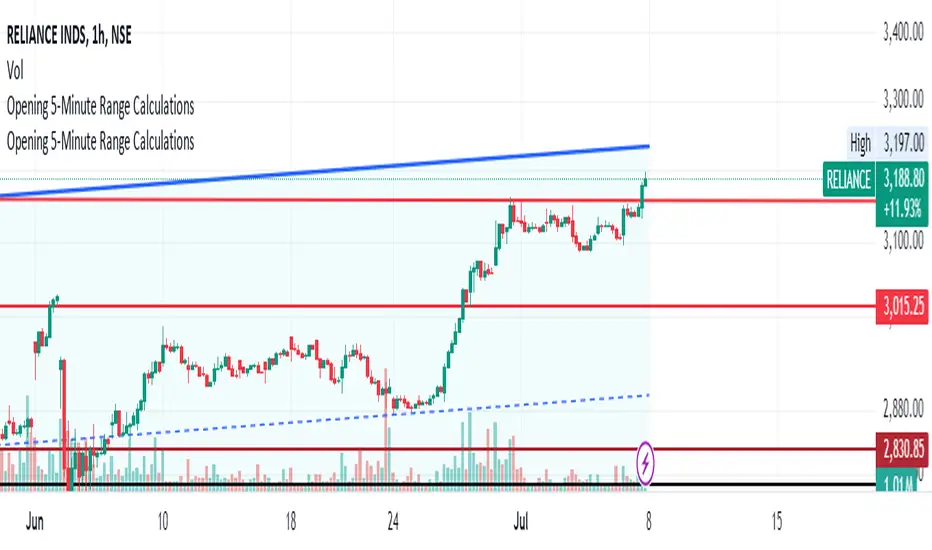
Opening 5-Minute Range Candle (A):
This represents the price range during the first 5 minutes of the trading day.
You can plot this as a vertical line connecting the high and low of the 5-minute candle.
Additionally, you can display the range values (high and low) as labels or in a table.
Multiply Opening Range Candle (A) with π (PI) Value (B):
Calculate the product of the opening range candle (A) and the value of π (approximately 3.14).
Plot this value as a line on the chart.
Optionally, you can label this line with the calculated value.
Divide B by 2 ©:
Divide the value obtained in step 2 (B) by 2.
Plot this value as another line on the chart.
You can also label this line with the calculated value.
Add C to A (D):
Sum the value of C (from step 3) with the opening range candle (A).
Plot this sum as a line on the chart.
Label this line accordingly.
Add C to D (E):
Add the value of C (from step 3) to the value of D (from step 4).
Plot this sum as another line on the chart.
Label it appropriately.
Add D to E (F):
Finally, add the value of D (from step 4) to the value of E (from step 5).
Plot this sum as a line with a distinct style (e.g., dashed or dotted) on the chart.
Label this line as well.
Remember that these steps involve mathematical calculations and plotting lines on the chart. You can customize the appearance (color, style, thickness) of each line and label according to your preferences. Additionally, consider adjusting the time frame to accurately capture the opening 5-minute range at 9:20:50 am.
Script de código aberto
Em verdadeiro espírito do TradingView, o criador deste script o tornou de código aberto, para que os traders possam revisar e verificar sua funcionalidade. Parabéns ao autor! Embora você possa usá-lo gratuitamente, lembre-se de que a republicação do código está sujeita às nossas Regras da Casa.
Aviso legal
As informações e publicações não se destinam a ser, e não constituem, conselhos ou recomendações financeiras, de investimento, comerciais ou de outro tipo fornecidos ou endossados pela TradingView. Leia mais nos Termos de Uso.