PROTECTED SOURCE SCRIPT
Z_MUTIL_CANDEL_v1

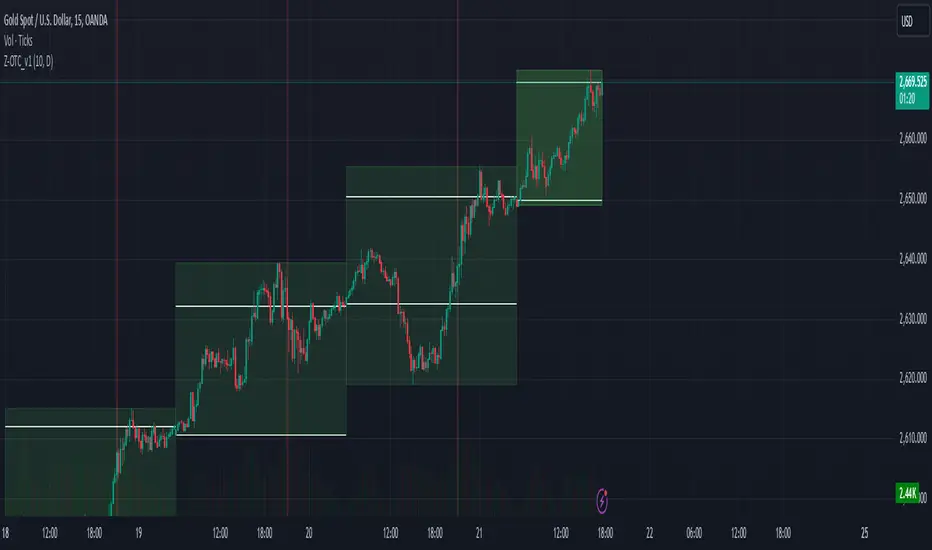
The Z_MUTIL_CANDEL_v1 indicator is designed to visually represent detailed candlestick information on a chart, overlaying multiple custom candlesticks based on a selected timeframe. This tool provides an enhanced visual understanding of price dynamics, making it easier to analyze trends and volatility.
Key Features:
Customizable Timeframe:
The indicator allows users to select a custom timeframe (default: Daily).
Displays candlestick data (Open, High, Low, Close) from the chosen timeframe.
Custom Candlestick Drawing:
Draws additional candlesticks at customizable positions to visualize key price levels:
Open/Close lines: Highlighted with solid white horizontal lines.
High/Low boxes: Represent the candlestick body and shadows with adjustable colors.
Candlestick colors:
Green: For bullish candles (Close >= Open).
Red: For bearish candles (Close < Open).
Detailed Labels:
Displays information next to the candlestick, including:
The selected timeframe.
Time left for the current bar to close (in HH:mm
format).
The candlestick range (High - Low).
Dynamic Background Highlight:
Highlights the chart's background in red with 80% transparency during a specific time (e.g., 9:00 AM to 9:01 AM).
Customizable Inputs:
Body size (pixels): Adjustable position of the custom candlesticks on the chart.
Show Candlestick Option: Option to display or hide the additional candlesticks.
Multiple Candlestick Layers:
Supports overlaying multiple custom candlesticks for comparison or enhanced visualization.
Practical Applications:
Enhanced Market Analysis: Use the detailed candlestick visuals and labels to better understand price movements and identify potential trading opportunities.
Timeframe Comparison: Compare custom timeframe candles against the current chart for multi-timeframe analysis.
Critical Time Identification: Highlight and analyze market behavior during specific hours using the background coloring feature.
How to Use:
Add the Indicator to Your Chart:
Open the TradingView editor and apply the script.
Adjust the settings to match your analysis needs.
Analyze Custom Candlesticks:
Observe the additional candlesticks and their corresponding data (timeframe, price range, etc.).
Leverage Time-Based Insights:
Use the countdown timer to monitor session closures or key levels around specific times.
Enhance your trading insights by utilizing the Z_MUTIL_CANDEL_v1 indicator for detailed candlestick visualization and analysis. 🚀
Script protegido
Esse script é publicada como código fechado. No entanto, você pode gerenciar suas escolhas de bate-papo. Por favor, abra suas Configurações do perfil
Aviso legal
As informações e publicações não se destinam a ser, e não constituem, conselhos ou recomendações financeiras, de investimento, comerciais ou de outro tipo fornecidos ou endossados pela TradingView. Leia mais nos Termos de Uso.