OPEN-SOURCE SCRIPT
QQE
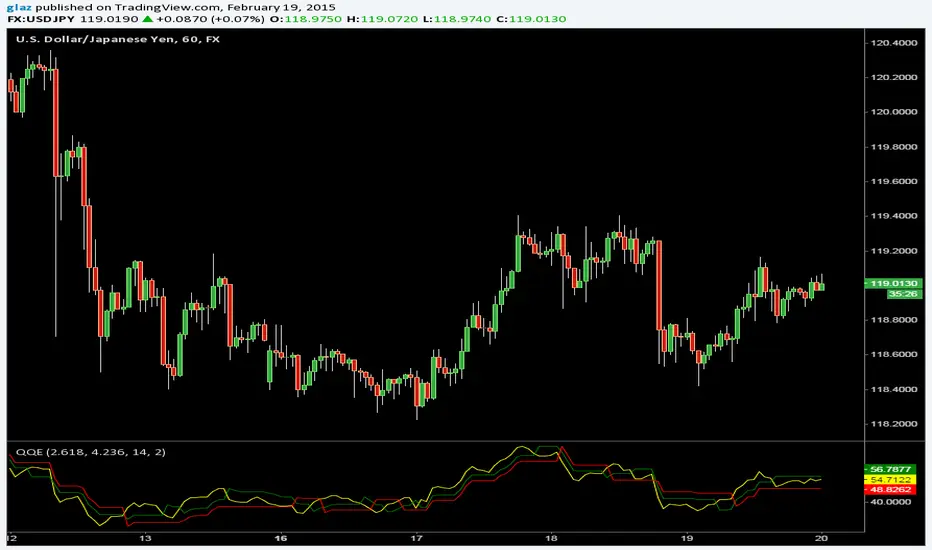
The Metastock version of Quantative Qualitative Estimation with two trailing stop lines and more options
Yellow line can be hidden if its too many signals and expirement with the Slow/Fast Trailing stop lines.
Yellow line can be hidden if its too many signals and expirement with the Slow/Fast Trailing stop lines.
Script de código aberto
Em verdadeiro espírito do TradingView, o criador deste script o tornou de código aberto, para que os traders possam revisar e verificar sua funcionalidade. Parabéns ao autor! Embora você possa usá-lo gratuitamente, lembre-se de que a republicação do código está sujeita às nossas Regras da Casa.
Aviso legal
As informações e publicações não se destinam a ser, e não constituem, conselhos ou recomendações financeiras, de investimento, comerciais ou de outro tipo fornecidos ou endossados pela TradingView. Leia mais nos Termos de Uso.