OPEN-SOURCE SCRIPT
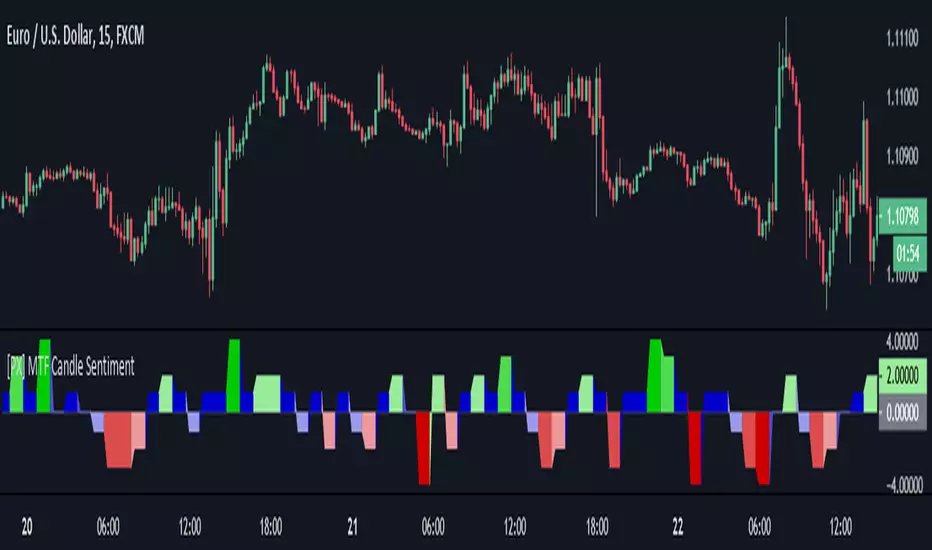
[PX] MTF Candle Sentiment

This indicator calculates the candlestick sentiment for the selected timeframe. The calculation consists of two steps:
Those two steps create 9 possible scores, which will determine the color of the graph.
If you are looking for someone to develop your own indicator or trading strategy, don't hesitate to get in touch with me here on TradingView or below.
Contact:
pascal-simon.de
info@pascal-simon.de
- Step 1: Positioning of the closing price:
Upper Third = High Close
Mid Third = Mid Close
Lower Third = Low Close - Step 2: Positioning of the closing price in comparison to its previous candle:
Close above the high of the previous candle = Bull candle
Close within the range of the previous candle = Range candle
Close below the low of the previous candle = Bear candle
Those two steps create 9 possible scores, which will determine the color of the graph.
If you are looking for someone to develop your own indicator or trading strategy, don't hesitate to get in touch with me here on TradingView or below.
Contact:
pascal-simon.de
info@pascal-simon.de
Script de código aberto
Em verdadeiro espírito do TradingView, o criador deste script o tornou de código aberto, para que os traders possam revisar e verificar sua funcionalidade. Parabéns ao autor! Embora você possa usá-lo gratuitamente, lembre-se de que a republicação do código está sujeita às nossas Regras da Casa.
🙋♂️Listed as "Trusted Pine Programmer for Hire"
💰Save $30 on your Tradingview subscription: bit.ly/3OtLyNz
🔓Indicator access: dize-trading.de/
🔒Trial access: discord.gg/DqwKjBZ8Qe
💰Save $30 on your Tradingview subscription: bit.ly/3OtLyNz
🔓Indicator access: dize-trading.de/
🔒Trial access: discord.gg/DqwKjBZ8Qe
Aviso legal
As informações e publicações não se destinam a ser, e não constituem, conselhos ou recomendações financeiras, de investimento, comerciais ou de outro tipo fornecidos ou endossados pela TradingView. Leia mais nos Termos de Uso.