RSI with OB and OS zones
Basic rules for trading with BB and RSI:
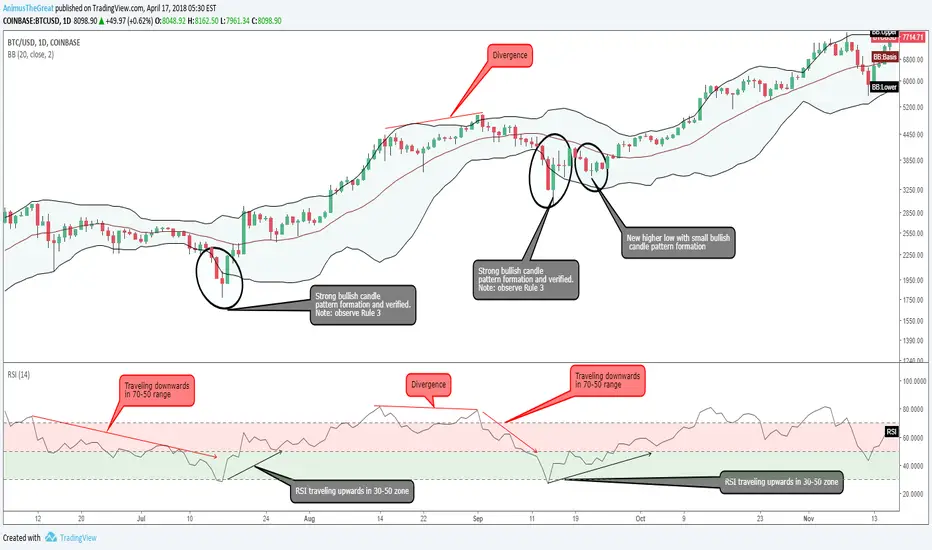
- When a new high/low price trades outside a band and subsequent highs/lows are falling inside the band...signal for possible price/trend reversal.
- Compare the Bollinger bandwidth at key price levels. The bands constrict and provide an early warning signal before a big price change
Connected with RSI:
Rule #1
Once the price hits the bottom of the band, RSI needs to be in between 50 and 30. If it is for example at the 75 mark, than this might not be something you would be interested in. At the same time you need to see also RSI go up, in this case, in direction of the trade. If you are planning to short the trade, RSI needs to be in between 50-70 mark and going downward.
Rule #2- Find a cryptocurrency that is in uptrend if you are planning to go long, or downtrend if you are planning to short the trade. Skip sideways trending currencies.
Rule #3 - The currency must fall back (from the uptrend) and drops out, touches, or almost touches the bottom band. Once the price touches the bottom of the band, look a the RSI indicator for confirmation (needs to be in 30-50 range moving upwards). At the same time you need to see also RSI go up, in this case, in direction of the trade. If you are planning to short the trade, RSI needs to be in between 50-70 mark and going downward.
Rule #4: After price hits lower Bollinger band, and RSI is going upwards, make entry when…
…when you see STRONG BULLISH candle to the upside, you see consecutive reversal candles to the upside, or you find a bullish pattern forming. You need to see that the trend is moving upwards, in this case, before you enter a trade.
If the candlesticks are moving to a point where it is making a new low, this would not be a good time to enter a trade. However, once the candles fail to make a new low watch to see if it forms a bullish formation. Something else you can consider is when the price touches the middle band you can make a second entry to press your winners.
Script sob convite
Somente usuários aprovados pelo autor podem acessar este script. Você precisará solicitar e obter permissão para usá-lo. Normalmente, essa permissão é concedida após o pagamento. Para obter mais detalhes, siga as instruções do autor abaixo ou entre em contato diretamente com AnimusTheGreat.
A TradingView NÃO recomenda pagar ou usar um script, a menos que você confie totalmente em seu autor e entenda como ele funciona. Você também pode encontrar alternativas gratuitas e de código aberto em nossos scripts da comunidade.
Instruções do autor
Aviso legal
Script sob convite
Somente usuários aprovados pelo autor podem acessar este script. Você precisará solicitar e obter permissão para usá-lo. Normalmente, essa permissão é concedida após o pagamento. Para obter mais detalhes, siga as instruções do autor abaixo ou entre em contato diretamente com AnimusTheGreat.
A TradingView NÃO recomenda pagar ou usar um script, a menos que você confie totalmente em seu autor e entenda como ele funciona. Você também pode encontrar alternativas gratuitas e de código aberto em nossos scripts da comunidade.