PROTECTED SOURCE SCRIPT
Atualizado Fibonacci MA7
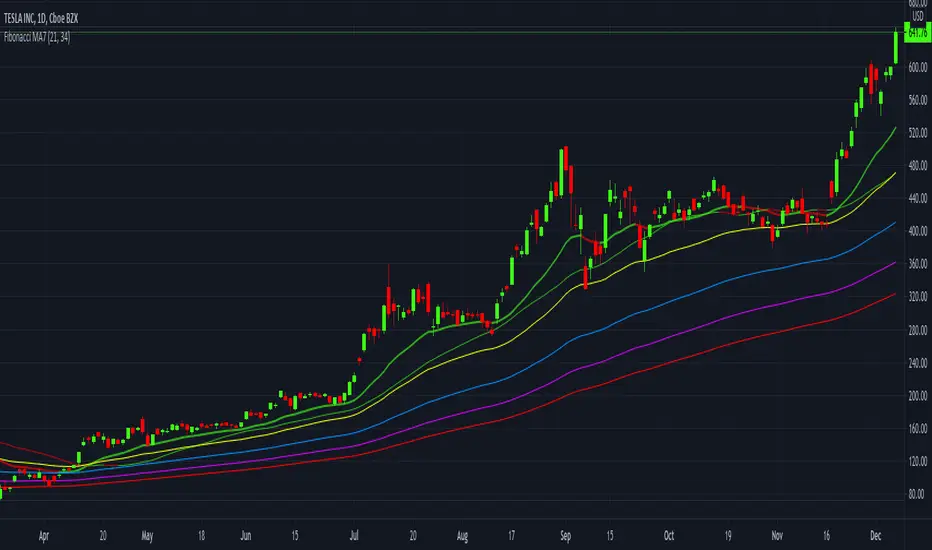
Fibonacci MA7 is a price indicator with 7 moving averages. It's inputs are based on the Fibonacci sequence 21, 34, 55, 89, 144, 233 & 377.
The tightest moving averages 21 & 34 are EMA ( exponential moving average ) & SMA ( simple moving average ) respectively. This helps give insight to the shortest time frame price action direction.
The next 5 are all EMA ( exponential moving average ) 55, 89, 144, 233 & 377 to help give a gradient of medium to long term price action history.
The colors can all be changed to your liking, but my color scheme is 21/34 green (red with a crossover), 55 blue , 89 white, 144 purple, 233 yellow, 377 red.
The most bullish pattern is when all colors are in a top down order of green, blue, white, purple, yellow, red. And the most bearish pattern is when all colors are in a bottom up order of green, blue, white, purple, yellow, red.
Also, a crossover, cross-under, divergence or convergence of these colors, help signal the future price action. For example, green crossing over other colors is heading bullish , green crossing under other colors is bearish .
Good luck and happy trading friends...
Notas de Lançamento
MA source switched to high, low, close average instead of just close. Default color adjustments.Notas de Lançamento
I updated MA input to high, low, close average, instead of just close. Adjustments to default colors.Notas de Lançamento
I added another choice to click a checkbox in settings to use common moving averages 50, 100, 200 with another option to have them ema or sma. Good luck and happy trading friends...Notas de Lançamento
input tweak = ohlc4Notas de Lançamento
added MA150 to the common group choice of 50, 100, 200. still has toggle between ema or smaNotas de Lançamento
upgrade to version5add Fibonacci sequence #'s 610 & 987
Notas de Lançamento
header updateNotas de Lançamento
7/17/23 update:Add VWMA (Volume Weighted Moving Average) options
Add VWAP (Anchored Volume Weighted Average Price) option
Script protegido
Esse script é publicada como código fechado. No entanto, você pode gerenciar suas escolhas de bate-papo. Por favor, abra suas Configurações do perfil
Trading indicators:
tradingview.com/u/Options360/
tradingview.com/u/Options360/
Aviso legal
As informações e publicações não se destinam a ser, e não constituem, conselhos ou recomendações financeiras, de investimento, comerciais ou de outro tipo fornecidos ou endossados pela TradingView. Leia mais nos Termos de Uso.