Quantify [Trading Model] | Fractalyst
What’s the indicator’s purpose and functionality?
You know how to identify market bias but always struggle with figuring out the best exit method, or even hesitating to take your trades?
I've been there. That's why I built this solution—once and for all—to help traders who know the market bias but need a systematic and quantitative approach for their entries and trade management.
A model that shows you real-time market probabilities and insights, so you can focus on execution with confidence—not doubt or FOMO.
How does this Quantify [Trading Model] differentiate from Quantify [Entry Model]?
Have you managed to code or even found an indicator that identifies the market bias for you, so you don’t have to manually spend time analyzing the market and trend?
Then that’s exactly why you might need the Quantify Trading Model.
With the Trading Model (TM) version, the script automatically uses your given bias identification method to determine the trend (bull vs bear and neutral), detect the bias, and provide instant insight into the trades you could’ve taken.
To avoid complications from consecutive signals, it uses a kNN machine learning algorithm that processes market structure and probabilities to predict the best future patterns.
(You don’t have to deal with any complexity—it’s all taken care of for you.)
Quantify TM uses the k-Nearest Neighbors (kNN) machine learning algorithm to learn from historical market patterns and adapt to changing market structures. This means it can recognize similar market conditions from the past and apply those lessons to current trading decisions.
On the other hand, Quantify EM requires you to manually select your directional bias. It then focuses solely on generating entry signals based on that pre-determined bias.
While the entry model version (EM) uses your manual bias selection to determine the trend, it then provides insights into trades you could’ve taken and should be taking.
Trading Model (TM)
- Uses `input.source()` to incorporate your personal methodology for identifying market bias
- Automates everything—from bias detection to entry and exit decisions
- Adapts to market bias changes through kNN machine learning optimization
- Reduces human intervention in trading decisions, limiting emotional interference
Entry Model (EM)
- Focuses specifically on optimizing entry points within your pre-selected directional bias
- Requires manual input for determining market bias
- Provides entry signals without automating alerts or bias rules
Can the indicator be applied to any market approach/trading strategy?
Yes, if you have clear rules for identifying the market bias, then you can code your bias detection and then use the input.source() user input to retrieve the direction from your own indicator, then the Quantify [TM] uses machine-learning identify the best setups for you.
Here's an example:
Once you've created your custom bias indicator, you can integrate it with Quantify [TM]:
- Add your bias indicator to your chart
- Open the Quantify settings
- Set the Bias option to "Auto"
- Select your custom indicator as the bias source
The machine learning algorithms will then analyze historical price action and identify optimal setups based on your defined bias parameters. Performance statistics are displayed in summary tables, allowing you to evaluate effectiveness across different timeframes.
Can the indicator be used for different timeframes or trading styles?
Yes, regardless of the timeframe you’d like to take your entries, the indicator adapts to your trading style.
Whether you’re a swing trader, scalper, or even a position trader, the algorithm dynamically evaluates market conditions across your chosen timeframe.
How Quantify [TM] Helps You Trade Profitably?
The Quantify Trading Model offers several powerful features that can significantly improve your trading profitability when used correctly:
Real-Time Edge Assessment
It displays real-time probability of price moving in your favor versus hitting your stoploss
This gives you immediate insight into risk/reward dynamics before entering trades
You can make more informed decisions by knowing the statistical likelihood of success
Historical Edge Validation
Instantly shows whether your trading approach has demonstrated an edge in historical data
Prevents you from trading setups that historically haven't performed well
Gives confidence when entering trades that have proven statistical advantages
Optimized Position Sizing
Analyzes each setup's success rate to determine the adjusted Kelly criterion formula
Customizes position sizing based on your selected maximum drawdown tolerance
Helps prevent account-destroying losses while maximizing growth potential
Advanced Exit Management
Utilizes market structure-based trailing stop-loss mechanisms
Maximizes the average risk-reward ratio profit per winning trade
Helps capture larger moves while protecting gains during market reversals
Emotional Discipline Enforcement
Eliminates emotional bias by adhering to your pre-defined rules for market direction
Prevents impulsive decisions by providing objective entry and exit signals
Creates psychological distance between your emotions and trading decisions
Overtrading Prevention
Highlights only setups that demonstrate positive expectancy
Reduces frequency of low-probability trades
Conserves capital for higher-quality opportunities
Systematic Approach Benefits
By combining machine learning algorithms with your personal bias identification methods, Quantify helps transform discretionary trading approaches into more systematic, probability-based strategies.
What Entry Models are used in Quantify Trading Model version?
The Quantify Trading Model utilizes two primary entry models to identify high-probability trade setups:
Breakout Entry Model
- Identifies potential trade entries when price breaks through significant swing highs and swing lows
- Captures momentum as price moves beyond established trading ranges
- Particularly effective in trending markets when combined with the appropriate bias detection
- Optimized by machine learning to filter false breakouts based on historical performance
Fractals Entry Model
- Utilizes fractal patterns to identify potential reversal or continuation points
- Also uses swing levels to determine optimal entry locations
- Based on the concept that market structure repeats across different timeframes
- Identifies local highs and lows that form natural entry points
- Enhanced by machine learning to recognize the most profitable fractal formations
- These entry models work in conjunction with your custom bias indicator to ensure trades are taken in the direction of the overall market trend. The machine learning component analyzes historical performance of these entry types across different market conditions to optimize entry timing and signal quality.
How Does This Indicator Identify Market Structure?
1. Swing Detection
• The indicator identifies key swing points on the chart. These are local highs or lows where the price reverses direction, forming the foundation of market structure.
2. Structural Break Validation
• A structural break is flagged when a candle closes above a previous swing high (bullish) or below a previous swing low (bearish).
• Break Confirmation Process:
To confirm the break, the indicator applies the following rules:
• Valid Swing Preceding the Break: There must be at least one valid swing point before the break.
3. Numeric Labeling
• Each confirmed structural break is assigned a unique numeric ID starting from 1.
• This helps traders track breaks sequentially and analyze how the market structure evolves over time.
4. Liquidity and Invalidation Zones
• For every confirmed structural break, the indicator highlights two critical zones:
1. Liquidity Zone (LIQ): Represents the structural liquidity level.
2. Invalidation Zone (INV): Acts as Invalidation point if the structure fails to hold.
How does the trailing stop-loss work? what are the underlying calculations?
A trailing stoploss is a dynamic risk management tool that moves with the price as the market trend continues in the trader’s favor. Unlike a fixed take profit, which stays at a set level, the trailing stoploss automatically adjusts itself as the market moves, locking in profits as the price advances.
In Quantify, the trailing stoploss is enhanced by incorporating market structure liquidity levels (explain above). This ensures that the stoploss adjusts intelligently based on key price levels, allowing the trader to stay in the trade as long as the trend remains intact, while also protecting profits if the market reverses.
What is the Kelly Criterion, and how does it work in Quantify?
The Kelly Criterion is a mathematical formula used to determine the optimal position size for each trade, maximizing long-term growth while minimizing the risk of large drawdowns. It calculates the percentage of your portfolio to risk on a trade based on the probability of winning and the expected payoff.
Quantify integrates this with user-defined inputs to dynamically calculate the most effective position size in percentage, aligning with the trader’s risk tolerance and desired exposure.
How does Quantify use the Kelly Criterion in practice?
Quantify uses the Kelly Criterion to optimize position sizing based on the following factors:
1. Confidence Level: The model assesses the confidence level in the trade setup based on historical data and sample size. A higher confidence level increases the suggested position size because the trade has a higher probability of success.
2. Max Allowed Drawdown (User-Defined): Traders can set their preferred maximum allowed drawdown, which dictates how much loss is acceptable before reducing position size or stopping trading. Quantify uses this input to ensure that risk exposure aligns with the trader’s risk tolerance.
3. Probabilities: Quantify calculates the probabilities of success for each trade setup. The higher the probability of a successful trade (based on historical price action and liquidity levels), the larger the position size suggested by the Kelly Criterion.
How can I get started to use the indicator?
1. Set Your Market Bias
• Choose Auto.
• Select the source you want Quantify to use as for bias identification method (explained above)
2. Choose Your Entry Timeframes
• Specify the timeframes you want to focus on for trade entries.
• The indicator will dynamically analyze these timeframes to provide optimal setups.
3. Choose Your Entry Model and BE/TP Levels
• Choose a model that suits your personality
• Choose a level where you'd like the script to take profit or move stop-loss to BE
4. Set and activate the alerts
What tables are used in the Quantify?
• Quarterly
• Monthly
• Weekly
Terms and Conditions | Disclaimer
Our charting tools are provided for informational and educational purposes only and should not be construed as financial, investment, or trading advice. They are not intended to forecast market movements or offer specific recommendations. Users should understand that past performance does not guarantee future results and should not base financial decisions solely on historical data.
Built-in components, features, and functionalities of our charting tools are the intellectual property of Fractalyst Unauthorized use, reproduction, or distribution of these proprietary elements is prohibited.
- By continuing to use our charting tools, the user acknowledges and accepts the Terms and Conditions outlined in this legal disclaimer and agrees to respect our intellectual property rights and comply with all applicable laws and regulations.
Improved multi-timeframe table colorization logic that highlights the most profitable timeframes based on profit factor, enabling faster identification of optimal trading setups.
- Automated Machine Learning: The script now automatically adjusts machine learning parameters based on usage patterns, eliminating the need for manual configuration.
Improvements
- Enhanced Kelly Criterion: Refined the Kelly criterion calculation for more accurate position sizing and improved risk management.
- Tooltips now include additional notes and tips to improve usability and provide guidance for traders on selecting optimal settings.
- Auto Level Detection: Added "Auto" option in level detection functionality. The script now intelligently determines the optimal or trailing stoploss method based on market conditions.
- Daily PnL Table: Implemented a new daily table showing Risk-Reward PnL comparison between current and previous week. Helps traders track performance improvements over time.
Improvements
- Enhanced models performance by optimizing calculation method
- Profit Factor: Ratio of gross profits to gross losses, measuring the system's profitability efficiency.
- Expectancy: Represents the average expected profit per trade.
- Win/Loss Statistics: Detailed breakdown of wins, losses, and break-even percentages, along with maximum consecutive wins/losses to evaluate strategy consistency.
- Drawdown Metrics: Added Maximum Drawdown (largest peak-to-trough decline) and Average Drawdown measurements to better assess risk exposure.
- Sharpe Ratio: Risk-adjusted return metric that compares profitability against volatility, with higher values indicating better risk-adjusted performance.
- Ulcer Index: Measures the depth and duration of drawdowns, focusing on downside volatility. Lower values indicate less painful drawdowns and faster recovery periods.
- MAE/MFE: Maximum Adverse Excursion/Maximum Favorable Excursion analysis to show how far trades move against or in favor before closing, helping optimize entry/exit timing.
- Risk of Ruin (RoR): Calculates the probability of losing your entire trading capital or reaching a point where continued trading becomes impossible.
- Duration Analysis: Average trade duration statistics to help traders understand typical holding periods for different market conditions.
- Aggressive Trailing Stop-Loss: Implemented a new trailing stop-loss algorithm specifically optimized for forex markets:
- Dynamically adjusts based on market volatility
- Helps capture larger portions of trends while protecting profits
- Configurable sensitivity settings
Improved
- Performance Optimization: Refactored code logic for significantly faster calculations:
- Reduced memory usage by 30%
- Decreased indicator loading time on large datasets
- Optimized loop structures for better performance on historical data analysis
**Major Feature Addition: Pyramiding Trades**
- Compounding Performance Calculations
- Completely revamped performance metrics to calculate based on compounding effects rather than R-multiples for more realistic performance measurement
- Added support for pyramiding (position stacking) that allows adding positions after the initial trade's stop-loss has moved to breakeven
- Implemented user toggleable pyramiding with "ON/OFF" setting via user interface
- Added maximum pyramid entries control (currently supports 1 additional position)
- Created pyramid entry detection logic that automatically triggers when stop-loss moves to breakeven
- Implemented separate risk calculation for pyramid entries to maintain consistent risk management
- Added visual indicators and alerts for pyramid entries on the chart
- Integrated pyramid position management with existing trailing stop mechanism
**Risk Management for Pyramiding**
- Implemented separate position sizing calculation for pyramid entries based on market conditions
- Incorporated pyramid trade results in performance statistics accounting for compound risk effect
- Enhanced profit calculation to account for multiple entry points in the same trade direction
## Backtesting Table and Metrics Improvements
**Enhanced Performance Metrics**
- Added robust Sharpe Ratio calculation for risk-adjusted return measurement
- Implemented Ulcer Index to measure depth and duration of drawdowns
- Added Risk of Ruin calculation based on Kelly Criterion
- Integrated CAGR (Compound Annual Growth Rate) for annualized performance comparison
- Added MAE/MFE (Maximum Adverse Excursion/Maximum Favorable Excursion) ratio to measure trade efficiency
- Implemented recovery factor and peak equity tracking
**Table UI and Visualization Improvements**
- Reorganized backtesting table for better readability with logical grouping of metrics
- Added comprehensive tooltips explaining each metric with performance benchmarks
- Implemented color-coding system to quickly identify strengths and weaknesses
- Enhanced visibility of key performance indicators with conditional formatting
- Created separate view options for Backtest, Monthly, Weekly, and Daily performance analysis
- Improved confidence level calculation based on sample size
**Statistical Analysis Enhancements**
- Added tracking for maximum consecutive wins and losses
- Implemented separate statistics tracking for bullish and bearish trades
- Added combined total performance statistics across all trade types
- Enhanced drawdown analysis with separate tracking for realized and maximum drawdowns
- Improved trade duration tracking and reporting
## Calculation Logic and Performance Optimization
**Algorithmic Improvements**
- Implemented efficient single-pass algorithm for statistical calculations to reduce computational overhead
- Optimized Sharpe ratio and standard deviation calculations for better performance
- Enhanced Ulcer Index calculation with more efficient implementation
- Improved Kelly Criterion calculation with better handling of edge cases
- Optimized bias detection with pre-calculated values
**Code Optimization**
- Reduced redundant calculations by caching frequently used values
- Improved handling of array operations to minimize memory usage
- Implemented grouped assignments to reduce code size and improve readability
- Optimized conditional logic for better performance in trade management
- Pre-calculated array sizes to avoid multiple calls to array.size function
**Trade Management Refinements**
- Improved trailing stop logic for better trade exit timing
- Enhanced breakeven detection and management
- Optimized position sizing based on dynamic risk calculation
- Improved drawdown tracking during active trades
- Refined trade duration calculation for more accurate reporting
- Improved RoR calculation based on Kelly criterion formula
- Improved color threshold of metrics to be aligned with the detailed tooltips
- Improved script performance
- Added more detailed alerts
- Added Monthly Avg: Implemented compounded monthly return calculation for more granular periodic performance tracking
- Added Calmar Ratio: New risk-adjusted performance metric to assess returns relative to maximum drawdown risk
- Added p-value: Statistical significance testing to validate trading results against random chance hypothesis
- Added support for custom entry models that can be integrated seamlessly with Quantify's risk management
- Implemented ability to use external indicators as entry signals where +1 triggers long entries and -1 triggers short entries
- Enhanced bias detection with custom indicator support, allowing users to define their own market bias rules
Chart Visualization Improvements
- Redesigned trade labels with clearer R-multiple values and trade statistics
- Added position-specific labels for pyramid entries (marked as "#1" and "#2") to track multiple positions
- Implemented gap detection visualization in labels that highlights price gaps at trade entries/exits
- Color-coded win/loss percentages for improved visual assessment of trade outcomes
Performance Analytics
- Enhanced Backtesting Metrics
- Added comprehensive tooltips to all backtesting metrics explaining calculation methods and interpretation
- Statistical significance testing (p-value) for strategy validation
- Added gap statistics tracking to analyze the impact of overnight gaps on strategy performance
- Implemented risk-of-ruin calculation that adjusts position sizing based on statistical confidence
- Improved visualization of current risk levels with real-time updates
- Streamlined code for faster backtest processing
- Optimized statistics calculation for real-time updates
- Improved alert messages with detailed trade information and key statistics
- Added trade duration tracking and reporting in human-readable format
- Cleaner visualization with less chart clutter while maintaining detailed information
- TP Level Approach - Implemented new take-profit methodology for the exit model, specifically optimized for high winrate trading strategies
- Alert Enhancements - Improved alert details for better trading decision visibility and notification clarity
- Added WFE (Walk-Forward Efficiency) - Implemented robust calculation of the ratio between out-of-sample and in-sample performance to measure strategy resilience.
- Added Maximum Segment Contribution tracking - New metric measuring if any single period dominates total returns (should remain under 50%). Helps identify strategies that might be overly dependent on specific market conditions.
- Added Percentage of Profitable Segments - Tracks consistency of strategy performance across different market regimes.
- Improved segment boundary detection - Enhanced algorithm now properly identifies transitions between in-sample and out-of-sample periods, delivering more accurate WFA metrics.
Statistical Significance Improvements
- Enhanced p-value calculation accuracy using polynomial approximation of normal CDF instead of stepped approximation:
- Implemented two-tailed test handling - Now correctly calculates significance for both positive and negative deviations from expected performance.
Tooltip & User Interface Enhancements
- Added actionable insights to tooltips - Each metric now includes specific thresholds and practical interpretation guidance:
- WFE: "≥ 0.50: Strategy maintains at least 50% of its performance on unseen data (good)"
Profitable Segments: "≥ 70%: Strategy shows consistent profitability across different market regimes"
- Maximum Segment Contribution: "≤ 50%: Strategy profit is well-distributed across segments"
- Integrated color-coding based on metric health - Performance indicators now visually highlight whether metrics meet recommended thresholds.
- Added detailed component breakdowns in tooltips - Each metric now shows its underlying components for deeper analysis (e.g., in-sample vs. out-of-sample profit values).
- Reduced the number of pattern recognition rules in the fractal model to improve robustness
- Added Treynor Ratio to Risk Metrics Dashboard
- Implemented the Treynor ratio to measure excess return per unit of systematic risk
Formula used: (Portfolio Return - Risk-Free Rate) / Portfolio Beta
• Users can view distinct performance metrics for long (bullish) and short (bearish) strategies.
• Enhanced performance insights and more granular strategy evaluation.
- Improved visualizations
- Replaced Treynor ratio with Omega ratio to provide more actionable insights
- Enhanced metrics help traders make more informed decisions about strategy viability
- Combined with Walk-Forward Analysis (WFA) metrics for comprehensive strategy validation
Provides statistical confidence about how strategies might perform in future market conditions
Helps identify whether past performance is likely to continue or was merely the result of curve-fitting
What is Monte Carlo Simulation?
The Monte Carlo method runs hundreds of simulations by randomly reshuffling your historical trades to create different possible future scenarios. This helps identify how much of your strategy's performance might be due to luck versus skill, and provides a more realistic view of backtests.
- Full Distribution Analysis: Calculates not just average outcomes but the complete range of possible results: best-case, worst-case, and most likely scenarios.
- Improved built-in directional bias calculation logic
- Optimized the logic for better script performance
- Added avg stop size metric for better assessing the avg lot size and trade cost used per trade
- Added CVaR metric for measuring potential extreme losses beyond standard risk calculations, helping traders understand worst-case scenarios and make more informed risk management decisions.
CVaR (Conditional Value at Risk) provides a more conservative risk estimate than traditional VaR by focusing on the average loss in the worst-case scenarios. This gives you a clearer picture of potential downside in extremely volatile market conditions.
[iMax drawdown duration is informational and not a reason to reject a strategy; focus on diversifying across multiple strategies.
- Added Parameter Stability metric to evaluate how well trading parameters generalize between in-sample and out-of-sample periods
- Implemented sophisticated scaling of Parameter Stability based on profit consistency and absolute profit levels
- Added edge case handling for various in-sample/out-of-sample profit scenarios
Incorporated logarithmic scaling to properly weight meaningful profits vs barely positive results
Second Pyramiding Logic
- Added support for a second pyramid entry
- Implemented trailing stop-based trigger conditions for second pyramid entries
- Expanded trade result processing to handle multiple pyramid entries in a unified way
- Added specialized alerting for second pyramid entries with contextual information
Script Efficiency Improvements
- Optimized calculation routines with cached intermediate values to reduce redundant computations
- Restructured code with early-return patterns for faster execution in common cases
- Enhanced mathematical operations with single-pass algorithms for statistical calculations
- Optimized memory usage through targeted variable reuse and better object lifecycle management
- Improved auto bias detection using kNN (k-Nearest Neighbors) machine learning algorithm
0-100 numerical score with letter grade (A to F)
- Combines multiple Walk-Forward Analysis metrics into a single value
- Accounts for Walk-Forward Efficiency, parameter stability, segment consistency, and performance decay
- Applies intelligent bonuses for strategies with positive out-of-sample performance
- Improved script compounding accuracy
- Enhanced script logic & efficiency
- Added Hidden Markov Model (HMM) for Enhanced Market Regime Detection
- Select 'open' as the bias source to utilize advanced HMM-based market state identification
- Detects subtle transitions between trending, ranging, and volatile market conditions
- Provides more responsive bias detection for rapidly changing market environments
- Works alongside existing k-Nearest Neighbors (kNN) algorithm (active when 'close' is selected)
Intelligent Adaptive Trailing Stop-loss
- Dynamic stop placement based on detected market regime
- Automatically switches between conservative and aggressive trailing methods:
• Uses wider stops in trending markets aligned with trade direction to maximize profits
• Employs tighter stops in choppy or counter-trend conditions to protect gains
• Continuously adjusts as market conditions evolve throughout trade lifecycle
- Optimized for both capturing extended trends and protecting profits in volatile conditions
- Implemented linear regression analysis to track strategy performance trends over time
- Performance decay values range from 0.0 (severe degradation) to 1.0 (strong improvement)
Sharpe and Sortino ratios are only meaningful when evaluated at the portfolio level, not for individual strategies in isolation.
- Adaptability with new X1/X2 models
- Added "Kelly" column to the backtest performance table, showing optimal position size as a percentage of capital based on the Kelly Criterion.
- Implemented a sophisticated statistical method using standard deviation-based thresholds (±0.75σ)
- Probabilities now dynamically reflect the actual distribution of simulation outcomes
Enhanced Pyramiding Support
- Added user-configurable pyramiding with the "Stack" parameter in inputs
- Adjust maximum pyramid entries (1-10) for fine-tuned position sizing
- Full support for pyramid entries in trade tracking and visualization
Optimized Performance
- Implemented efficient block bootstrap for more realistic Monte Carlo simulations
- Added autocorrelation detection to determine optimal block size for trade sampling
- Pre-allocation of arrays for better memory management
- Single-pass calculation of statistics for faster execution
- Reduced redundant calculations in trade simulation
Enhanced Compounding Accuracy
- Better representation of actual trade sequence effects on balance growth
- Improved handling of sequential trade dependencies
- New "Auto" mode for trading costs that dynamically calculates costs from spread-to-stoploss ratio
- Spread detection for both tick and non-tick timeframes
- Cost calculation logic in all RR and trade evaluation functions
- Costs scale proportionally to market volatility and position risk
- Minimum cost floor to account for slippage
- Dual-Platform Alert System
- TradingView native alerts
- Discord webhook integration with rich embeds
- Trade Frequency: Added metric to measure average trades per month. This helps traders understand trading activity levels and optimize position management based on market conditions.
- OFP (Overfitting Probability): New metric that quantifies the likelihood of strategy overfitting. Lower scores indicate more robust strategies that are less likely to break down in live trading.
Improvements:
- Enhanced alert options to include Telegram alongside Discord and TradingView
- Optimized table rendering for improved performance
- Performance: Increased overall profitability by adapting entry and exit mechanics to market conditions
- Risk Management: Reduced maximum drawdown through better entry timing
- Consistency: Achieved higher win rate due to more precise entry/exit conditions
- Improved table quantitative tooltips
- Improved Built-in Adaptive Model when custom bias is not selected
- Improved Max CW/CL tooltip insights
- Users can now integrate up to 3 custom regime detection models simultaneously
- Unanimous consensus system: signals only trigger when all connected models agree
- Smart model count display in performance table (shows specific model names for single models, count for multiple)
Enhanced Walk-Forward Analysis
- Walk-Forward Analysis table automatically activates when multiple custom models are integrated
- Advanced overfitting detection and robustness scoring to validate model combinations
- Helps users avoid overfitted strategies by analyzing out-of-sample performance consistency
• Performance-Based Adjustment: Uses composite scoring algorithm combining multiple performance metrics
[u]Enhanced Statistical Filter with Anderson-Darling Integration[/u]
• Advanced Statistical Validation: Integrated Anderson-Darling test for normality assessment of stop-loss distance distributions
• Dynamic Threshold Adjustment: Stop-loss validation now adapts based on statistical significance and distribution characteristics
• Improved Risk Management: Enhanced filtering reduces false signals and improves trade quality
Key Benefits:
- Prevent Overfitting: Detects strategies that only work on specific historical periods
- Temporal Robustness: Validates performance across different market regimes
- Real-World Simulation: Mimics actual trading conditions with train/test splits
- Parameter Stability: Identifies strategies with consistent performance over time
How It Works:
1. 5-Fold Temporal Split: Divides historical data into 5 chronological segments
2. Rolling Validation: Each fold trains on past data, tests on future data
3. Performance Aggregation: Combines results to calculate CV Score and Consistency
4. Risk Adjustment: Uses Sharpe ratios for risk-adjusted performance measurement
- CV Score and CV Consistency now use purged validation
- More Realistic : Better mimics real-world trading conditions
- Robust Validation : Provides more conservative and reliable performance estimates
- Custom bias integration, custom entry integration, Custom exit integration
- Backtesting results will differ (more realistic)
- Entry alerts now show "EXECUTED at Open"
- Prevents unrealistic, instant-loss entries when the market gaps through the stop.
- Set to 1–5 (or -1 to -5) to use progressively wider swing pivots:
1 = most aggressive (fastest), 5 = most conservative (slowest)
- Consistent behavior: The chosen exit mode is locked in at entry and does not change during the trade.
- Backward-compatible: If Exit Source isn’t 1–5, the previous trailing logic is used automatically.
- Added custom trailing logic integration
- Improved negative EV trailing shadows
- 3 custom sources are now used solely for bias integration
- Optimized script calculation logic
- Added Minimal/Maximal layout enabling users to adjust based no their preferences
- Improved stoploss size handling logic resulting in improved overall trade expectancy
- Improved visuals
- Avg Win % and Avg Loss % are now included in backtest table
- Real-Time Performance Tracking: Metrics now include unrealized gains/losses from open positions, not just closed trades. This provides continuous performance measurement (Equity-based) rather than discrete updates only when positions close (Balance-based).
- Accurate Drawdown Calculation: Maximum drawdown now reflects true account risk by measuring equity peaks and troughs. Balance-based calculations missed significant unrealized losses that could trigger psychological pressure points.
- Live Trading Alignment: Equity-based metrics mirror how live trading platforms calculate performance. Your Sharpe ratio, return percentages, and risk metrics now match what you'd see in actual trading conditions with floating P&L.
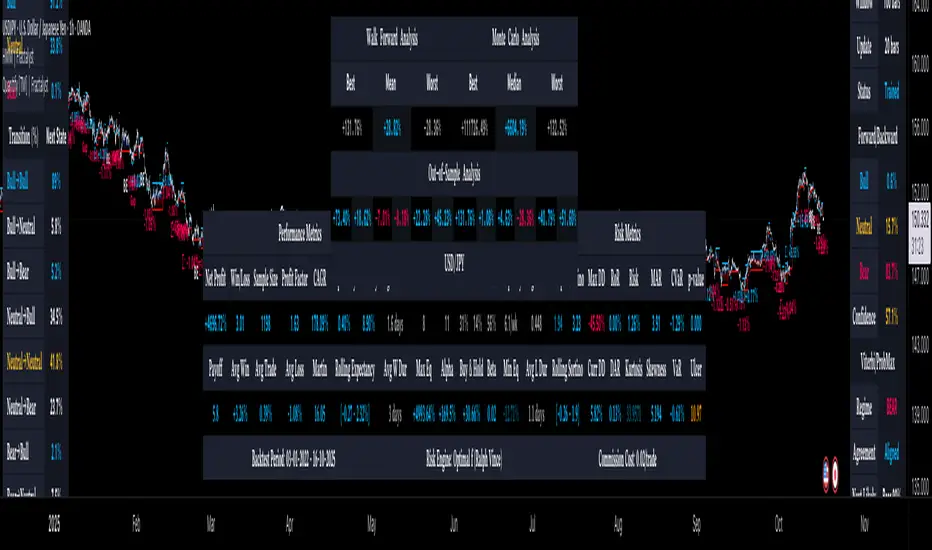
This change introduces a robust way to validate a strategy’s durability out of sample, and scaffolds a probabilistic “what could happen” view.
Below is a explanation of how the new pieces work and how to read them.
What changed at a glance
- Walk-Forward Analysis (WFA) now runs automatically on your closed trades and summarizes out‑of‑sample results in the top‑center table (Walk‑Forward section).
Monte Carlo columns are added to the same top table as a placeholder for upcoming probabilistic simulations.
Walk-Forward Analysis (WFA):
Train on the past, then test on the next chunk of unseen trades. Repeat this “walk forward” across the entire history.
The key question: “Does the edge show up when we apply it to new, not‑yet‑seen trades?”
How we split the data
The trade history is cut into repeating segments.
Each segment is split: about 80% for “In‑Sample” (IS; learn/tune) and 20% for “Out‑of‑Sample” (OOS; test/validate).
We “walk” the window forward by exactly one OOS block each time, ensuring OOS blocks are contiguous and do not overlap in a way that leaks future information.
Why this shape matters
Using a fixed 80/20 split with a step equal to the OOS size ensures each OOS slice is a clean “new” test.
Contiguous OOS chunks mimic how time really unfolds—no cherry‑picking or skipping “hard” periods.
We derive the segment length so that the walk produces the requested number of OOS windows (default is set to 12).
The first IS begins at the very first trade.
The final OOS window is extended to the end so the full trade history is utilized.
What we measure
For every window, we compute the compounded return on OOS trades. This produces a list of results across all windows.
From that list we summarize:
Best/Mean/Worst OOS performance (shown in the top‑center table).
How to read it
- If the Mean OOS is positive and the Worst OOS isn’t catastrophic, the edge is more likely to be real (not overfit).
If there aren’t enough closed trades to form even one full IS+OOS segment, WFA will not force a result; it leaves the table blank (“–”) rather than making up numbers.
Monte Carlo:
Answer, “What could happen next?” by simulating many alternative paths of performance that are consistent with your observed trade distribution.
It’s not predicting the future; it’s exploring a range of plausible outcomes.
What we’ll simulate
Many hypothetical equity paths based on your historical trade returns.
Approaches can include:
Simple “bootstrap” (randomly sampling past trade results with replacement).
“Block bootstrap” (sampling runs of trades to respect streaks and clustering).
We then collect the distribution of returns from all simulated paths.
What you’ll see
In the top‑center table (Monte Carlo section), we’ll summarize Best/Median/Worst across all simulated paths.
The “Simulations” count is shown in the table footer so you know the breadth of the sampling.
How to use it
If your historical performance sits near the median simulated outcome, you’re likely seeing a realistic result rather than one that relies on a lucky order of wins and losses.
If the lower tail (worst cases) is unacceptable, you can proactively adjust bet size, filters, or stop policies to avoid ruin.
What it won’t do
It doesn’t guarantee future returns. It quantifies uncertainty based on past patterns.
If markets regime‑shift (they often do), simulations based on the past may underestimate risk.
Why both, together, matter
WFA tells you whether your edge survives first contact with new data. It’s your “proof of concept” against overfitting.
Monte Carlo tells you how wide the outcome range can be even if the edge is real. It’s your “margin of safety” for capital planning.
Used together:
WFA validates the edge.
Monte Carlo sizes the risk around that edge.
Practical reading guide
Start with Walk‑Forward (top‑center table, left section)
Check the Best/Mean/Worst OOS results. You want a resilient mean and a tolerable worst case.
Consult Monte Carlo (top‑center table, right section) when enabled
Compare historical results to the Monte Carlo median and worst—plan your position sizing around the downside tail, not the best case.
- Strategy Volatility Annualization: Now uses bar-based timespan calculation with annualization formula `σ × √(periods_per_year)` for accurate risk assessment across all timeframes.
These tools provide different approaches to position sizing and risk assessment based on user preference.
Features Added
Value at Risk (VaR)
Purpose
VaR quantifies the maximum potential loss for a given time period at a specified confidence level.
Function
The model analyzes historical trade data to calculate the worst-case loss scenario. It provides a specific percentage or dollar amount representing the maximum expected loss under normal market conditions. The calculation updates continuously as new trade data becomes available.
Application
VaR establishes risk thresholds before entering trades. At a 95% confidence level, a VaR of 6.5% indicates that losses should not exceed 6.5% of capital in 95 out of 100 trading periods. This enables traders to understand their exposure and set appropriate risk limits.
Optimal f
Purpose
Optimal f determines the mathematically ideal position size to maximize long-term account growth while managing risk of ruin.
Function
The algorithm analyzes trade history including win rates, average wins, and average losses. It calculates the optimal percentage of capital to risk per trade that balances growth potential against drawdown risk. The calculation automatically adjusts as trading performance evolves.
Application
If Optimal f calculates 1.3%, this represents the statistically optimal risk per trade based on the strategy's historical performance. Risking less slows growth; risking more increases probability of significant losses.
Implementation Details
VaR Calculation
Method: Historical simulation
Confidence Level: 95%
Analysis Window: Rolling calculation based on recent trades
Output: Maximum expected loss threshold
Base Risk: 1% per trade (conservative baseline)
Optimal f Calculation
Method: Kelly Criterion variant
Required Inputs: Win rate, win/loss ratio
Safety Constraints: Capped to prevent over-leverage
Output: Recommended position size percentage
Base Risk: Dynamically calculated using Kelly formula
Risk Mode Selection
The system operates in three distinct modes:
VaR Mode
Uses 1% base risk per trade. The VaR model then adjusts this baseline based on historical volatility and drawdown analysis. Prioritizes capital preservation.
Optimal f Mode
Uses Kelly Criterion to calculate base risk. The algorithm determines optimal position sizing mathematically from win rate and risk/reward ratios. Prioritizes growth optimization.
Flat Percent Mode
Uses fixed 1% risk per trade without dynamic adjustment. Provides consistent, predictable position sizing across all trades.
Configuration
Automatic Operation
Both models operate automatically without manual intervention. Users can access:
Real-time VaR metrics in the risk dashboard
Data Requirements
Both models require sufficient historical data for accurate calculations. Minimum of 20 trades recommended for reliable results.
Important Considerations
VaR calculations assume normal market conditions; extreme events may exceed VaR estimates
Optimal f provides guidance based on past performance; future results may vary
All recommendations should be validated through backtesting before live implementation, always take precedence for final safety control
- Improved from 90-95% to 100% statistical reliability
- Better extreme scenario (tail risk) estimation
- More representative best/worst case projections
Entry and exit alerts only fire when a fresh trade actually opens or closes, and back-to-back duplicate entries are filtered out.
- Added Coefficient of Variations color threshold rule to ensure metric consistency across available windows
Changes:
- Walk Forward Analysis - Mean: Added CV calculation and three-tier color logic
- Bullish (green): Mean > 0 AND CV < 100%
- Bearish (red): Mean ≤ 0 AND CV ≥ 100%
- Orange: Mixed conditions (one passes, one fails)
- Monte Carlo Analysis - Median: Added CV calculation and three-tier color logic
- Bullish (green): Median > 0 AND CV < 100%
- Bearish (red): Median ≤ 0 AND CV ≥ 100%
- Orange: Mixed conditions (one passes, one fails)
Technical Details:
- CV Formula: `|(Best - Worst) / (2√3) / Mean| × 100%` (range-to-stdev approximation)
Benefits:
- Provides visual consistency assessment for stress test results
- Helps identify stable vs volatile OOS performance
- Aligns with existing Rolling Expectancy/Sortino metric standards
Connect any indicator outputting trend confidence (0-1 scale) to automatically adjust stop tightness based on market conditions.
Script sob convite
Somente usuários aprovados pelo autor podem acessar este script. Você precisará solicitar e obter permissão para usá-lo. Normalmente, essa permissão é concedida após o pagamento. Para obter mais detalhes, siga as instruções do autor abaixo ou entre em contato diretamente com Fractalyst.
A TradingView NÃO recomenda pagar ou usar um script, a menos que você confie totalmente em seu autor e entenda como ele funciona. Você também pode encontrar alternativas gratuitas e de código aberto em nossos scripts da comunidade.
Instruções do autor
darwinexzero.com/darwin/XRPV/performance
🎯 | Entry Model:
whop.com/fractalyst
📥 | Work with Me:
fractalyst.net
Aviso legal
Script sob convite
Somente usuários aprovados pelo autor podem acessar este script. Você precisará solicitar e obter permissão para usá-lo. Normalmente, essa permissão é concedida após o pagamento. Para obter mais detalhes, siga as instruções do autor abaixo ou entre em contato diretamente com Fractalyst.
A TradingView NÃO recomenda pagar ou usar um script, a menos que você confie totalmente em seu autor e entenda como ele funciona. Você também pode encontrar alternativas gratuitas e de código aberto em nossos scripts da comunidade.
Instruções do autor
darwinexzero.com/darwin/XRPV/performance
🎯 | Entry Model:
whop.com/fractalyst
📥 | Work with Me:
fractalyst.net