OPEN-SOURCE SCRIPT
Trend Finder

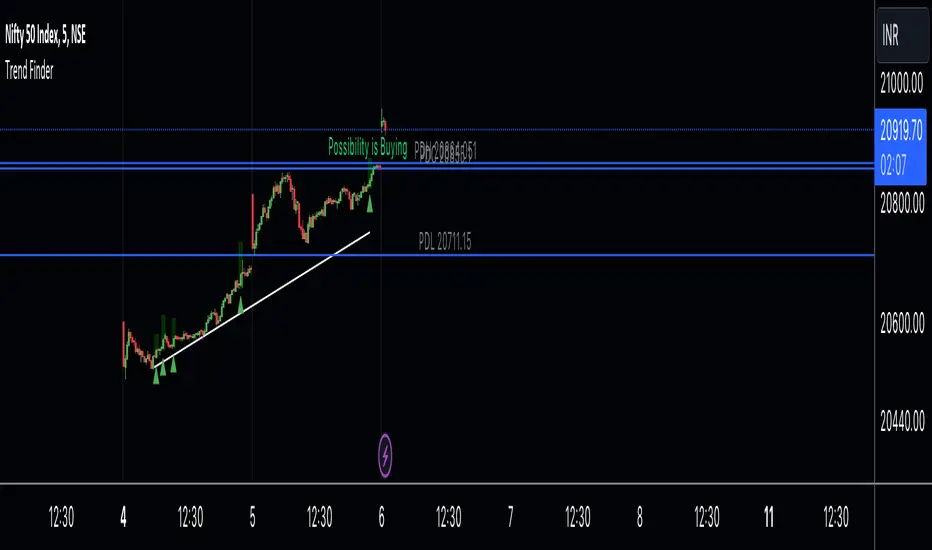
A Trend Finder is a specialized indicator designed to analyze market trends by combining pivot points and candlestick patterns. This hybrid approach aims to provide more accurate signals for identifying potential market directions. Here's a refined description of its features and usage:
**Overview:**
A Trend Finder indicator utilizes a combination of pivot points and candlestick patterns to offer insights into the prevailing market trend. By incorporating both elements, it seeks to enhance the accuracy of trend analysis.
**How to Use Trend Finder:**
Using the Trend Finder is straightforward and involves interpreting the signals provided by different coloured boxes:
1. **Green Box (Bull Box):**
- Indicates a potential uptrend in the market.
- Highlights possible market direction and key points.
- Offers insights into bullish market conditions.
2. **Red Box (Downtrend Box):**
- Signals a potential downtrend in the market.
- Illustrates possible downward market direction and pivotal points.
- Provides an estimate of potential market decline using pivot point calculations.
**Customization Options:**
The Trend Finder comes with customization options to tailor the analysis based on candlestick patterns. Users can adjust these settings to refine the accuracy of trend identification.
**Additional Features:**
The indicator includes extra features to enhance its functionality:
- Displays the previous day's high, low, and close values.
- Utilizes this historical data to suggest potential trend directions.
- Enables users to make informed trading decisions based on past market behaviour.
**Usage Guidelines:**
Traders can use the Trend Finder by observing the signals within the coloured boxes, considering the pivot point calculations, and factoring in candlestick patterns. The indicator's flexibility allows users to adjust settings to better align with their preferred trading strategies.
In essence, the Trend Finder serves as a comprehensive tool for traders seeking a nuanced understanding of market trends. By combining pivotal technical indicators, it aims to provide a more accurate depiction of potential market movements, assisting traders in making informed decisions.
Script de código aberto
Em verdadeiro espírito do TradingView, o criador deste script o tornou de código aberto, para que os traders possam revisar e verificar sua funcionalidade. Parabéns ao autor! Embora você possa usá-lo gratuitamente, lembre-se de que a republicação do código está sujeita às nossas Regras da Casa.
Aviso legal
As informações e publicações não se destinam a ser, e não constituem, conselhos ou recomendações financeiras, de investimento, comerciais ou de outro tipo fornecidos ou endossados pela TradingView. Leia mais nos Termos de Uso.