OPEN-SOURCE SCRIPT
FVG within Specific NY Time
Disclaimer: This indicator is designed solely for educational and informational purposes. The creator assumes no liability for any financial losses incurred as a result of utilizing this indicator or strategy. Users are advised to exercise discretion and consult with a professional advisor before engaging in trading based on this tool.
Strategy Overview
This strategy focuses on pinpointing unfilled Fixed Value Gaps (FVGs) within a five-minute timeframe during predetermined intervals throughout the day, which we term "Liquidity Injection Intervals." The concept of this strategy is that unfilled FVGs in these intervals will likely be tested before continuation of the trend.
To implement this strategy:
Liquidity Injection Intervals (EST/NY Time):
How to use this Indicator
Add this indicator to your chart
Set the chart timeframe to 5m
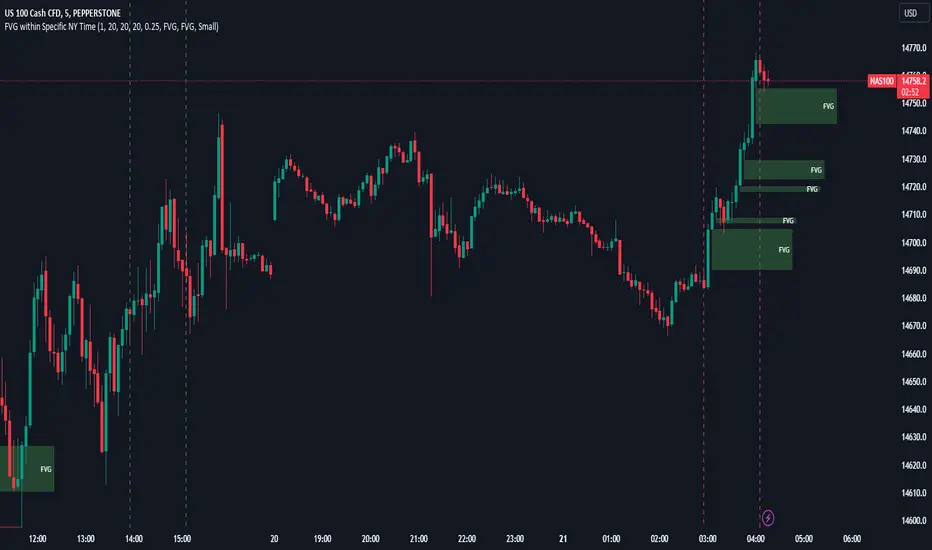
This indicator will highlight the predefined intervals using dotted vertical lines and draw identify the FVG. Do note that this indicator does not display FVGs that have been filled. You are to manually identify the stop loss and take profit.
Feel free to use this code and adapt it to your own trading strategies. Happy trading!
Strategy Overview
This strategy focuses on pinpointing unfilled Fixed Value Gaps (FVGs) within a five-minute timeframe during predetermined intervals throughout the day, which we term "Liquidity Injection Intervals." The concept of this strategy is that unfilled FVGs in these intervals will likely be tested before continuation of the trend.
To implement this strategy:
- Identify an FVG, ideally closer to the end of the specified time interval.
Place entry orders anticipating the gap to be filled. - Set stop-loss orders at the extremity of the wick from which the FVG originated. If the FVG arises amidst a sustained directional movement, the stop should be placed at the wick of the initiating candle of that movement.
- While there is no predefined target profit (TP) for this strategy, I would advice to aim for at least a 2:1 Reward to Risk. Ensure that your TP lies within a plausible reach, considering the price action of that day.
Liquidity Injection Intervals (EST/NY Time):
- 3 AM - 4 AM
- 10 AM - 11 AM
- 2 PM - 3 PM
How to use this Indicator
Add this indicator to your chart
Set the chart timeframe to 5m
This indicator will highlight the predefined intervals using dotted vertical lines and draw identify the FVG. Do note that this indicator does not display FVGs that have been filled. You are to manually identify the stop loss and take profit.
Feel free to use this code and adapt it to your own trading strategies. Happy trading!
Script de código aberto
Em verdadeiro espírito do TradingView, o criador deste script o tornou de código aberto, para que os traders possam revisar e verificar sua funcionalidade. Parabéns ao autor! Embora você possa usá-lo gratuitamente, lembre-se de que a republicação do código está sujeita às nossas Regras da Casa.
Aviso legal
As informações e publicações não se destinam a ser, e não constituem, conselhos ou recomendações financeiras, de investimento, comerciais ou de outro tipo fornecidos ou endossados pela TradingView. Leia mais nos Termos de Uso.