PROTECTED SOURCE SCRIPT
Atualizado NQ/MNQ Futures Delta+ with Price Action Entries
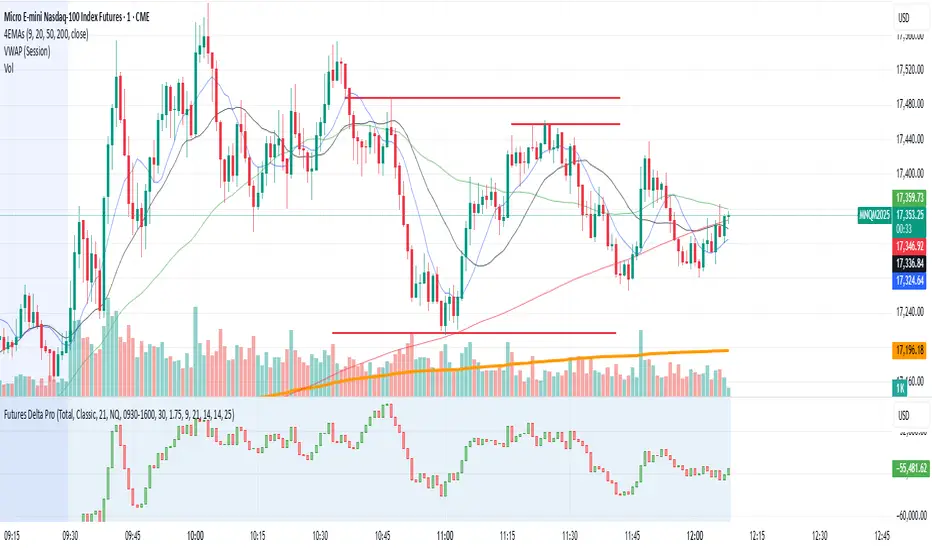
NQ/MNQ Futures Delta+ with Price Action Entries
Description: This TradingView indicator combines Futures Delta analysis with advanced price action techniques to provide an enhanced trading strategy for the NQ/MNQ futures market. The script analyzes the market using a variety of methods including Delta, volume analysis, and candlestick patterns, while also incorporating price action factors like support/resistance levels and breakouts to offer more refined buy and sell signals.
Key Features:
Delta Analysis:
The Delta calculation tracks the difference between buying and selling pressure within each market bar. The indicator calculates delta based on different modes (Classic, Volume Based, Tick Based), and then applies cumulative delta for trend analysis.
The Cumulative Delta is calculated using one of the three available modes:
Total: Tracks the cumulative delta over time.
Periodic: Measures delta over a defined period (user-configurable).
EMA: Applies an Exponential Moving Average to smooth the delta values.
Volume Confirmation:
The script includes volume analysis to confirm price movements. A volume spike is used to validate buy/sell signals, ensuring that price movements are supported by significant trading volume.
Price Action-Based Entries:
Support and Resistance: Dynamic support and resistance levels are calculated based on the lowest low and highest high of the last 20 bars. These levels are used to identify breakout points, providing context for potential buy/sell entries.
Candlestick Patterns: The script recognizes Bullish Engulfing and Bearish Engulfing candlestick patterns. These patterns signal potential reversals in price direction and are used to confirm trade entries.
Breakout Logic: Buy signals are triggered when the price breaks above resistance, and sell signals are triggered when the price breaks below support, providing high-probability entry points during trend reversals or continuations.
Moving Average Trend Confirmation:
The script uses two moving averages:
9-period Exponential Moving Average (EMA): Short-term trend indicator.
21-period Exponential Moving Average (EMA): Longer-term trend indicator.
Trades are only considered in the direction of the prevailing trend:
A bullish signal is confirmed if the price is above both EMAs.
A bearish signal is confirmed if the price is below both EMAs.
Buy/Sell Signal Triggers:
Buy Signal: A buy signal is triggered when:
A bullish divergence is confirmed with volume support.
A bullish engulfing candlestick pattern forms.
The price breaks above resistance.
The price is above both the 9 EMA and 21 EMA, indicating an uptrend.
Sell Signal: A sell signal is triggered when:
A bearish divergence is confirmed with volume support.
A bearish engulfing candlestick pattern forms.
The price breaks below support.
The price is below both the 9 EMA and 21 EMA, indicating a downtrend.
Visualization:
Delta Candles: The cumulative delta is plotted as a candlestick on the chart, with green and red coloring to show buying or selling dominance.
Support and Resistance Levels: Support and resistance zones are plotted to show key levels where price action may react.
Moving Averages: The 9 EMA and 21 EMA are plotted to show short-term and long-term trend direction.
Signal Markers: Buy and sell signals are marked on the chart with green triangles (buy) and red triangles (sell) for easy visualization of trade opportunities.
Alerts:
Alerts can be set up for buy and sell signals, enabling you to be notified when the script identifies potential trade opportunities based on Delta analysis, volume confirmation, and price action.
How to Use This Script:
Market: This script is optimized for NQ and MNQ futures contracts but can be adapted for other markets as well.
Signal Interpretation: Use the buy and sell signals for trend-following or counter-trend trades. These signals are particularly useful for 1-minute or 5-minute charts but can be adjusted to fit other timeframes.
Support/Resistance: Pay close attention to the dynamic support and resistance levels, as these are key price action points where significant price movements can occur.
Trend Confirmation: Ensure that trades are aligned with the overall trend confirmed by the 9 EMA and 21 EMA. The script prioritizes signals that align with the broader market trend.
Breakouts: Use the breakout logic to catch price moves when the market breaks key support or resistance levels. These can often lead to strong moves in the direction of the breakout.
Notas de Lançamento
Key Updates:Exhaustion Detection:
Buyer Exhaustion: If price is increasing and delta is decreasing, it suggests a lack of buying pressure and can indicate buyer exhaustion.
Seller Exhaustion: If price is decreasing and delta is increasing, it suggests a lack of selling pressure and can indicate seller exhaustion.
Highlighting Exhaustion:
Buyer Exhaustion is highlighted in green and Seller Exhaustion in red using bgcolor.
Background colors are used to highlight areas of interest where buyer or seller exhaustion is happening.
Volume Spike: Both conditions include volume spikes, where volume is greater than the average volume times the volume multiplier. This gives additional context for exhaustion.
Trend Confirmation: The exhaustion conditions also check if the price is above/below the 9 EMA and 21 EMA to ensure that the exhaustion happens in the context of the current trend.
Outcome:
Background highlights indicate areas where buyer exhaustion (green) or seller exhaustion (red) might occur.
The Delta candles and other indicators remain, but now with better insight into exhaustion points.
This should help in visualizing potential exhaustion points where price may reverse or pause. Let me know if you need further adjustments!
Script protegido
Esse script é publicada como código fechado. No entanto, você pode gerenciar suas escolhas de bate-papo. Por favor, abra suas Configurações do perfil
Aviso legal
As informações e publicações não se destinam a ser, e não constituem, conselhos ou recomendações financeiras, de investimento, comerciais ou de outro tipo fornecidos ou endossados pela TradingView. Leia mais nos Termos de Uso.