OPEN-SOURCE SCRIPT
CPI Inflation Monitor (Change YoY & MoM)
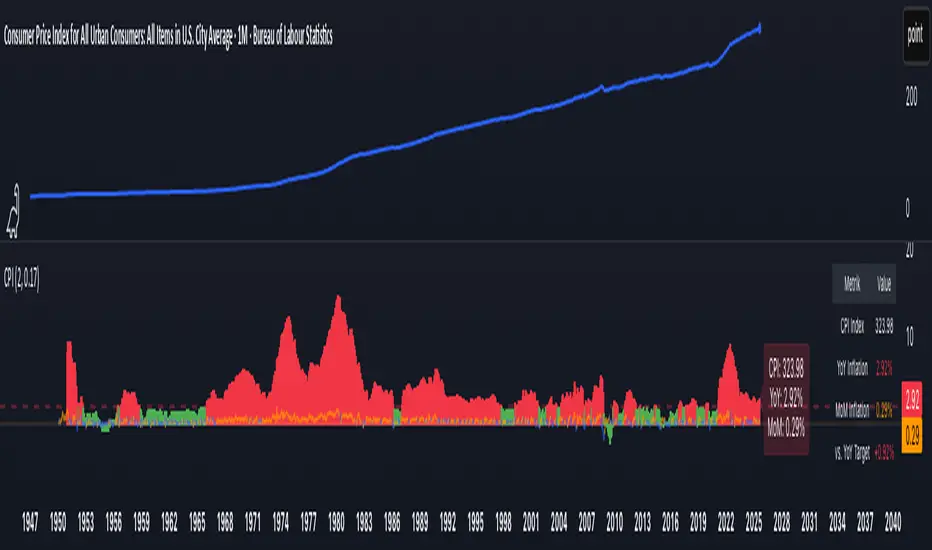
📊 CPI Inflation Monitor - Complete Macro Analysis Tool
This indicator provides a comprehensive view of Consumer Price Index (CPI) inflation trends, essential for understanding monetary policy, market conditions, and making informed trading decisions.
🎯 KEY FEATURES:
- Dual Perspective Analysis:
- Year-over-Year (YoY): Histogram bars showing annual inflation rate
- Month-over-Month (MoM): Line overlay showing monthly price changes
- Visual Reference System:
- Dashed line at 2% (Fed's official inflation target for YoY)
- Dotted line at 0.17% (equivalent monthly target for MoM)
- Color-coded bars: Red above target, Green below target
- Real-Time Data Table:
- Current CPI Index value
- YoY inflation rate with color coding
- MoM inflation rate with color coding
- Deviation from Fed target
- Automated Alerts:
- YoY crosses above/below 2% target
- MoM crosses above/below 0.17% target
- Perfect for staying informed without constant monitoring
📈 WHY THIS MATTERS FOR TRADERS:
CPI is the most widely reported inflation metric and directly influences:
- Federal Reserve interest rate decisions
- Bond yields and currency valuations
- Stock market sentiment (especially growth vs. value rotation)
- Cryptocurrency and risk asset performance
Rising inflation (red bars) typically leads to:
→ Higher interest rates → Negative for growth stocks, crypto
→ Stronger USD → Pressure on commodities
Falling inflation (green bars) typically leads to:
→ Rate cut expectations → Positive for growth stocks, crypto
→ Weaker USD → Support for commodities
🔍 HOW TO USE:
1. Strategic Positioning: Use YoY trend (thick bars) for long-term asset allocation
2. Tactical Timing: Use MoM trend (thin line) to identify turning points early
3. Divergence Trading: When MoM falls but YoY remains high, anticipate trend reversal
4. Fed Policy Prediction: Distance from 2% target indicates Fed's likely hawkishness
💡 PRO TIPS:
- Multiple months of MoM above 0.3% = Accelerating inflation → Fed turns hawkish
- MoM turning negative while YoY still elevated = Peak inflation → Position for pivot
- Compare with PPI and PCE indicators for complete inflation picture
- Use alerts to catch important threshold crossings automatically
📊 DATA SOURCE:
Official CPI data from FRED (Federal Reserve Economic Data), updated monthly mid-month when new data releases occur.
🎨 CUSTOMIZATION:
Fully customizable through settings:
- Toggle YoY/MoM displays
- Adjust target levels
- Customize colors for visual preference
- Show/hide absolute CPI values
Perfect for: Macro traders, swing traders, long-term investors, and anyone wanting to understand the inflation environment affecting their portfolio.
Note: This indicator works on any chart timeframe as it loads external monthly economic data.
Script de código aberto
Em verdadeiro espírito do TradingView, o criador deste script o tornou de código aberto, para que os traders possam revisar e verificar sua funcionalidade. Parabéns ao autor! Embora você possa usá-lo gratuitamente, lembre-se de que a republicação do código está sujeita às nossas Regras da Casa.
Aviso legal
As informações e publicações não se destinam a ser, e não constituem, conselhos ou recomendações financeiras, de investimento, comerciais ou de outro tipo fornecidos ou endossados pela TradingView. Leia mais nos Termos de Uso.