OPEN-SOURCE SCRIPT
SDSpike
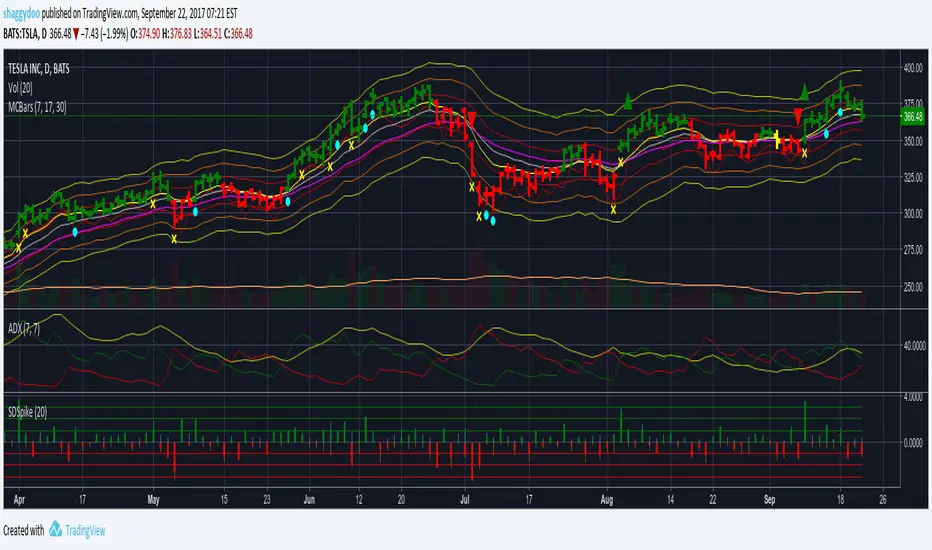
Price Change as Standard Deviation Spikes
Plots price changes scaled to daily StdDev for the period
The Close price change is plotted as a thick bar coloured green for up close, red for down close
The High price change is plotted as a thin bar coloured aqua
The Low price change is plotted as a thin bar coloured orange
Can be used to understand the statistical price behaviour of the symbol.
Very useful for earnings trades and in general for options trades.
Script de código aberto
Em verdadeiro espírito do TradingView, o criador deste script o tornou de código aberto, para que os traders possam revisar e verificar sua funcionalidade. Parabéns ao autor! Embora você possa usá-lo gratuitamente, lembre-se de que a republicação do código está sujeita às nossas Regras da Casa.
Aviso legal
As informações e publicações não se destinam a ser, e não constituem, conselhos ou recomendações financeiras, de investimento, comerciais ou de outro tipo fornecidos ou endossados pela TradingView. Leia mais nos Termos de Uso.