OPEN-SOURCE SCRIPT
Chart Fusion Line SND Detection & Signals by TitikSona
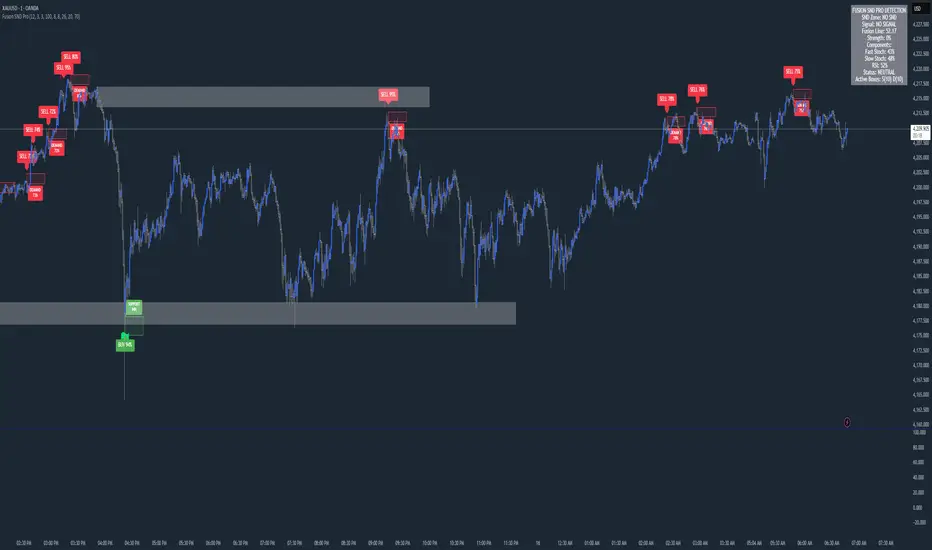
### Overview
Fusion Line Momentum Analyzer merges Double Stochastic and RSI into a single adaptive oscillator that visualizes momentum direction and strength.
It helps identify overbought and oversold conditions through a smooth blended curve that adapts across timeframes.
Designed for analytical purposes and to simplify momentum reading without complex triggers or repainting methods.
---
### Core Idea
The indicator fuses three classical momentum tools:
- Fast Stochastic (12,3,3) for short-term swings
- Slow Stochastic (100,8,8) for long-term momentum stability
- RSI (26) for measuring internal strength between buyers and sellers
These three are normalized and averaged into one unified line called the **Fusion Line**.
A secondary smoothing layer, the **Signal Line**, refines the direction and removes minor fluctuations.
---
### Features
- Unified momentum line combining Fast and Slow Stochastic with RSI
- Real-time momentum strength percentage (adaptive scale)
- Color-coded momentum bias for easy interpretation
- Optional info box showing component strength and overall state
- Background shading to visualize dominant momentum direction
- Optional alerts when Fusion Line crosses common momentum zones (20 and 80)
---
### Default Parameters
Fast Stochastic (12,3,3)
Slow Stochastic (100,8,8)
RSI Length (26)
Signal Line Smoothing (9)
All parameters can be modified to match volatility or personal style.
---
### How to Read
- A rising Fusion Line often reflects strengthening bullish momentum.
- A falling Fusion Line often reflects increasing bearish pressure.
- Strength percentage represents how dominant the current bias is.
- Extreme levels (near 20 or 80) indicate potential exhaustion or recovery areas.
Always interpret readings with market context such as trend direction, structure, and volume.
---
### Interpretation Guide
Low Fusion levels may indicate possible accumulation or recovery.
High Fusion levels may signal overextension or slowing momentum.
Neutral mid-levels represent balance between buying and selling pressure.
---
### Disclaimer
This script is an analytical visualization tool for studying market momentum.
It does not generate trading signals or predict market direction.
Always combine with structure, volume, and higher-timeframe context before making any trading decisions.
---
### Developer
Created by **TitikSona** — Research & Fusion Concept Designer
Built using **Pine Script v6**
Type: Open-source educational script
---
### Short Description
Adaptive momentum analyzer combining Double Stochastic and RSI into one Fusion Line with real-time strength visualization.
Script de código aberto
No verdadeiro espirito do TradingView, o autor desse script o publicou como código aberto, para que os traders possam entendê-lo e verificá-lo. Parabéns ao autor Você pode usá-lo gratuitamente, mas a reutilização desse código em publicações e regida pelas Regras da Casa.
Aviso legal
As informações e publicações não devem ser e não constituem conselhos ou recomendações financeiras, de investimento, de negociação ou de qualquer outro tipo, fornecidas ou endossadas pela TradingView. Leia mais em Termos de uso.