OPEN-SOURCE SCRIPT
Atualizado Backside Bubble Scalping
From LIHKG
Pine from Perplexity AI
以下是Backside Bubble Scalping策略的使用說明,旨在幫助交易者理解如何在美股交易中應用這一策略。
使用說明:Backside Bubble Scalping 策略
1. 前提條件
交易時間:此策略適用於香港時間晚上9:30 PM至12:00 AM。
圖表類型:使用1分鐘圖表進行交易。
2. 策略概述
Backside Bubble Scalping策略包含兩種主要的設置:尖backside和鈍backside。這些設置通常在10:00 PM至12:00 AM之間出現。
3. 指標設定
VWAP(粉紅色):成交量加權平均價格,用於識別市場趨勢。
9 EMA(綠色):9期指數移動平均線,用於捕捉短期價格變化。
4. 識別 Backside 設置
尖backside
特徵:
當市場趨勢為純紅色下跌,並形成尖尖的V形底部。
入場條件:
當價格突破9 EMA並經過小幅盤整後,進場做多。
鈍backside
特徵:
在混合顏色的趨勢中,形成鈍鈍的V形底部。
入場條件:
在盤整期間進場做多。
5. 止損和止盈設置
止損位置:
尖backside:設置在9 EMA上方的盤整範圍底部加上0.2。
鈍backside:設置在V底部的最低點加上0.2。
止盈位置:
尖backside:當價格跌破VWAP或出現一根K線沒有跟隨時出場。
鈍backside:當一根K線的三分之二身體向下突破9 EMA時出場。
6. 操作步驟
監控市場動態:在指定的交易時間內,觀察VWAP和9 EMA的變化。
識別入場信號:根據尖backside或鈍backside的條件進行判斷,確定何時進場。
設置止損和止盈:根據上述條件設置止損和止盈位,以管理風險。
執行交易:根據信號執行交易,並持續監控市場情況以調整策略。
7. 注意事項
避免在VWAP附近進行交易,以減少失敗風險。
如果出現影線(wick bar),建議不要進行交易,因為這可能表示該設置失敗。
Notas de Lançamento
From LIHKGPine from Perplexity AI
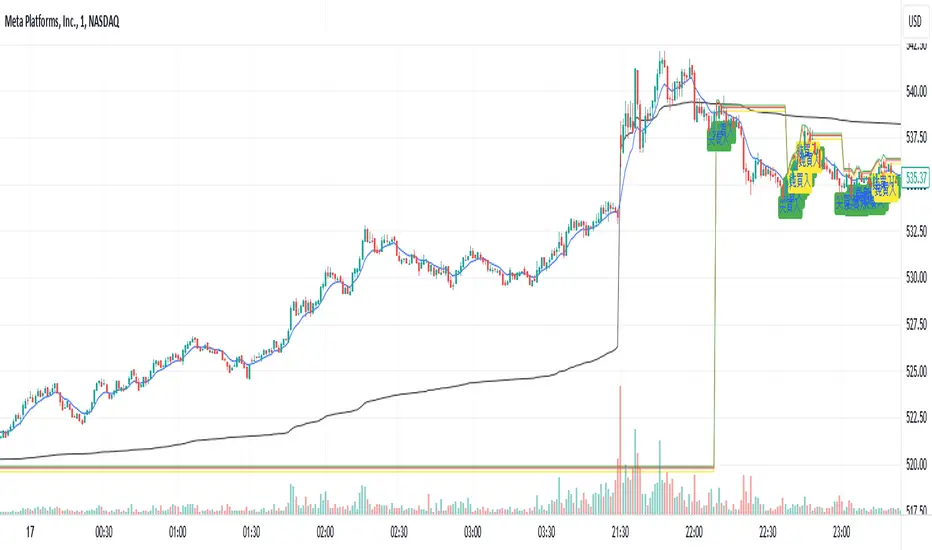
Backside Bubble Scalping 指標
這個指標旨在幫助交易者利用Backside Bubble Scalping策略在美股市場進行交易。它根據VWAP和9 EMA的關係識別兩種主要的Backside設置:尖backside和鈍backside。
指標特點:
- 在香港時間晚上9:30 PM至12:00 AM之間進行交易
- 使用1分鐘圖表
- 繪製VWAP(黑色)和9 EMA(藍色)
- 標示尖backside和鈍backside的買入信號
- 計算並繪製入場價格、止損位和止盈位
- 可選擇性地繪製賣出信號
使用方法:
1. 在指定的交易時間內,密切關注VWAP和9 EMA的變化
2. 根據尖backside或鈍backside的條件進場做多
3. 設置止損和止盈位以管理風險
4. 持續監控市場情況,根據策略的出場條件平倉
注意事項:
- 避免在VWAP附近進行交易
- 如果出現影線(wick bar),建議不要進場
- 可以調整賣出條件以減少賣出信號的頻率
祝你交易順利!如有任何問題歡迎隨時詢問。
Notas de Lançamento
From LIHKGPine from Perplexity AI
Backside Bubble Scalping Indicator
Overview
The Backside Bubble Scalping indicator is designed for traders looking to capitalize on short-term price movements in the stock market, particularly during the trading hours of 9:30 PM to 12:00 AM Hong Kong time. This strategy focuses on identifying two distinct setups: Sharp Backside and Blunt Backside, which typically occur between 10:00 PM and 12:00 AM.
Key Features
VWAP (Volume Weighted Average Price): Represented in pink, this line helps identify the average price at which the security has traded throughout the day, factoring in volume.
9 EMA (Exponential Moving Average): Shown in green, this line captures short-term price trends and helps identify potential reversals.
Setup Conditions
1. Sharp Backside
Market Condition: A pure downtrend where the price is below the VWAP.
Entry Criteria:
The current price is below VWAP.
The previous candle's close is lower than the current candle's close.
The current price is above the 9 EMA.
Signal: When these conditions are met, a "Sharp Buy" signal will be displayed.
2. Blunt Backside
Market Condition: A mixed trend characterized by consolidation with a dull V-shape.
Entry Criteria:
The current price is below VWAP.
The previous candle's close is higher than the current candle's close.
The current price must be above the previous candle's 9 EMA.
Signal: When these conditions are met, a "Blunt Buy" signal will be displayed.
Exit Conditions
Sell Signal: A sell signal will be generated when:
The price falls below the VWAP or below the 9 EMA.
Risk Management
Stop Loss: Set at a predefined buffer below the entry price to manage risk effectively.
Take Profit: Calculated based on a specified ratio relative to the stop loss distance.
Usage Instructions
Add the indicator to your TradingView chart.
Monitor for Sharp and Blunt Buy signals during the specified trading hours.
Use the VWAP and 9 EMA lines to assess market conditions before entering trades.
Set your stop loss and take profit according to your risk management strategy.
Conclusion
The Backside Bubble Scalping indicator provides traders with a structured approach to identifying potential entry points in a volatile market. By focusing on specific setups and utilizing key technical indicators, traders can enhance their decision-making process and improve their trading outcomes. Feel free to modify any part of this description to better fit your style or specific requirements!
Script de código aberto
Em verdadeiro espírito do TradingView, o criador deste script o tornou de código aberto, para que os traders possam revisar e verificar sua funcionalidade. Parabéns ao autor! Embora você possa usá-lo gratuitamente, lembre-se de que a republicação do código está sujeita às nossas Regras da Casa.
Aviso legal
As informações e publicações não se destinam a ser, e não constituem, conselhos ou recomendações financeiras, de investimento, comerciais ou de outro tipo fornecidos ou endossados pela TradingView. Leia mais nos Termos de Uso.