PROTECTED SOURCE SCRIPT
High/Low Percentage Difference
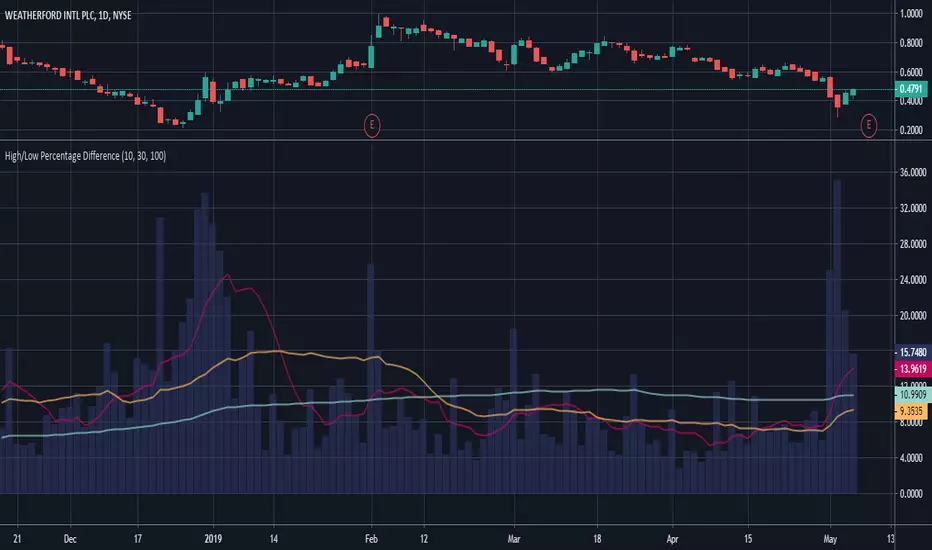
This chart shows simple moving averages of the differences in the high and low prices across the time frame you choose.
I use this when researching to see if the investment vehicle meets my criteria for volatility within the time-frame I want to invest.
The columns show the percentage difference between the current candle's high and low.
The lines show the SMA of the past 10(red), 30(orange), and 100(blue) candles, but you can edit these to be whatever you'd like.
Script protegido
Esse script é publicada como código fechado. No entanto, você pode gerenciar suas escolhas de bate-papo. Por favor, abra suas Configurações do perfil
Aviso legal
As informações e publicações não se destinam a ser, e não constituem, conselhos ou recomendações financeiras, de investimento, comerciais ou de outro tipo fornecidos ou endossados pela TradingView. Leia mais nos Termos de Uso.