PINE LIBRARY
MathStatisticsKernelDensityEstimation
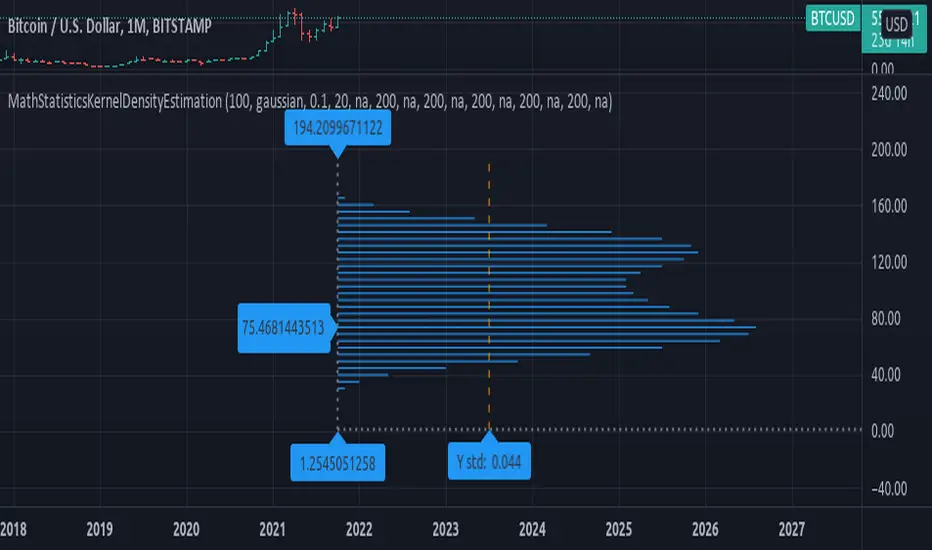
Library "MathStatisticsKernelDensityEstimation"
(KDE) Method for Kernel Density Estimation
kde(observations, kernel, bandwidth, nsteps)
Parameters:
Returns: tuple with signature: (float array, float array)
draw_horizontal(distribution_x, distribution_y, distribution_lines, graph_lines, graph_labels) Draw a horizontal distribution at current location on chart.
Parameters:
Returns: void, updates arrays: distribution_lines, graph_lines, graph_labels.
draw_vertical(distribution_x, distribution_y, distribution_lines, graph_lines, graph_labels) Draw a vertical distribution at current location on chart.
Parameters:
Returns: void, updates arrays: distribution_lines, graph_lines, graph_labels.
style_distribution(lines, horizontal, to_histogram, line_color, line_style, linewidth) Style the distribution lines.
Parameters:
Returns: void.
style_graph(lines, lines, horizontal, line_color, line_style, linewidth) Style the graph lines and labels
Parameters:
Returns: void.
(KDE) Method for Kernel Density Estimation
kde(observations, kernel, bandwidth, nsteps)
Parameters:
- observations: float array, sample data.
- kernel: string, the kernel to use, default='gaussian', options='uniform', 'triangle', 'epanechnikov', 'quartic', 'triweight', 'gaussian', 'cosine', 'logistic', 'sigmoid'.
- bandwidth: float, bandwidth to use in kernel, default=0.5, range=(0, +inf), less will smooth the data.
- nsteps: int, number of steps in range of distribution, default=20, this value is connected to how many line objects you can display per script.
Returns: tuple with signature: (float array, float array)
draw_horizontal(distribution_x, distribution_y, distribution_lines, graph_lines, graph_labels) Draw a horizontal distribution at current location on chart.
Parameters:
- distribution_x: float array, distribution points x value.
- distribution_y: float array, distribution points y value.
- distribution_lines: line array, array to append the distribution curve lines.
- graph_lines: line array, array to append the graph lines.
- graph_labels: label array, array to append the graph labels.
Returns: void, updates arrays: distribution_lines, graph_lines, graph_labels.
draw_vertical(distribution_x, distribution_y, distribution_lines, graph_lines, graph_labels) Draw a vertical distribution at current location on chart.
Parameters:
- distribution_x: float array, distribution points x value.
- distribution_y: float array, distribution points y value.
- distribution_lines: line array, array to append the distribution curve lines.
- graph_lines: line array, array to append the graph lines.
- graph_labels: label array, array to append the graph labels.
Returns: void, updates arrays: distribution_lines, graph_lines, graph_labels.
style_distribution(lines, horizontal, to_histogram, line_color, line_style, linewidth) Style the distribution lines.
Parameters:
- lines: line array, distribution lines to style.
- horizontal: bool, default=true, if the display is horizontal(true) or vertical(false).
- to_histogram: bool, default=false, if graph style should be switched to histogram.
- line_color: color, default=na, if defined will change the color of the lines.
- line_style: string, defaul=na, if defined will change the line style, options=('na', line.style_solid, line.style_dotted, line.style_dashed, line.style_arrow_right, line.style_arrow_left, line.style_arrow_both)
- linewidth: int, default=na, if defined will change the line width.
Returns: void.
style_graph(lines, lines, horizontal, line_color, line_style, linewidth) Style the graph lines and labels
Parameters:
- lines: line array, graph lines to style.
- lines: labels array, graph labels to style.
- horizontal: bool, default=true, if the display is horizontal(true) or vertical(false).
- line_color: color, default=na, if defined will change the color of the lines.
- line_style: string, defaul=na, if defined will change the line style, options=('na', line.style_solid, line.style_dotted, line.style_dashed, line.style_arrow_right, line.style_arrow_left, line.style_arrow_both)
- linewidth: int, default=na, if defined will change the line width.
Returns: void.
Biblioteca do Pine
Em verdadeiro espírito TradingView, o autor publicou este código Pine como uma biblioteca de código aberto para que outros programadores Pine da nossa comunidade possam reutilizá-lo. Parabéns ao autor! Você pode usar esta biblioteca de forma privada ou em outras publicações de código aberto, mas a reutilização deste código em publicações é regida pelas Regras da Casa.
Aviso legal
As informações e publicações não se destinam a ser, e não constituem, conselhos ou recomendações financeiras, de investimento, comerciais ou de outro tipo fornecidos ou endossados pela TradingView. Leia mais nos Termos de Uso.