OPEN-SOURCE SCRIPT
RSI Multi TF strategy
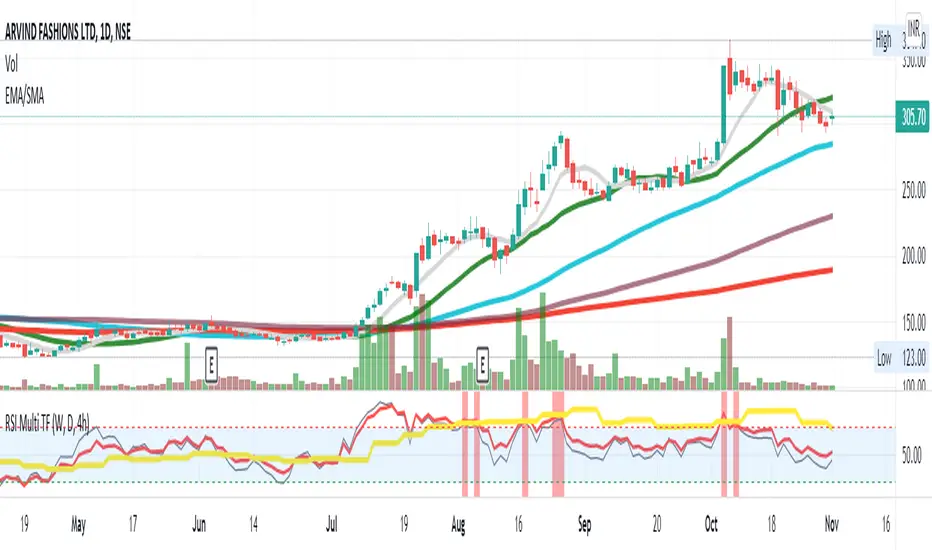
The RSI is a very popular indicator that follows price activity.
It calculates an average of the positive net changes, and an average
of the negative net changes in the most recent bars, and it determines
the ratio between these averages. The result is expressed as a number
between 0 and 100. Commonly it is said that if the RSI has a low value,
for example, 30 or under, the symbol is oversold. And if the RSI has a
high value, 70 for example, the symbol is overbought.
Plots 3 RSI (Weekly, Daily, 4h) at the same time, regardless of the Chart Timeframe.
Highlights in green (or red) if all RSI is oversold (or overbought).
Can trigger custom oversold and overbought alerts when all 3 lines grey(4h), yellow(weekly), and red(daily) go in the oversold or overbought zone. The strongest the curves break the barrier the strongest the alert (vertical red and green bars) shows.
Script de código aberto
Em verdadeiro espírito do TradingView, o criador deste script o tornou de código aberto, para que os traders possam revisar e verificar sua funcionalidade. Parabéns ao autor! Embora você possa usá-lo gratuitamente, lembre-se de que a republicação do código está sujeita às nossas Regras da Casa.
Aviso legal
As informações e publicações não se destinam a ser, e não constituem, conselhos ou recomendações financeiras, de investimento, comerciais ou de outro tipo fornecidos ou endossados pela TradingView. Leia mais nos Termos de Uso.