OPEN-SOURCE SCRIPT
GoatsGlowingRSI
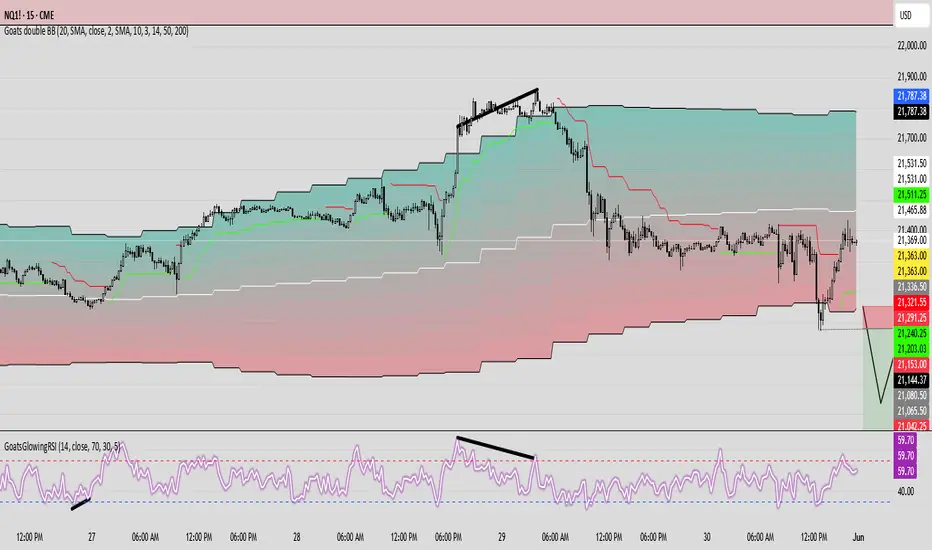
GoatsGlowingRSI is a visually enhanced and feature-rich RSI (Relative Strength Index) indicator designed for deeper market insight and clearer signal visualization. It combines standard RSI analysis with gradient-colored backgrounds, glowing effects, and automated divergence detection to help traders spot potential reversals and momentum shifts more effectively.
Key Features:
✅ Multi-Timeframe RSI:
Calculate RSI from any timeframe using the custom input. Leave it blank to use the current chart's timeframe.
✅ Dynamic Gradient Background:
A smooth gradient fill is applied between RSI levels from the lower band (30) to the upper band (70). The gradient shifts from blue (oversold) to red (overbought), visually highlighting the RSI's position and strength.
✅ Glowing RSI Line:
A three-layered glow effect surrounds the main RSI line, creating a striking white core with a purple aura that enhances visibility against dark or light chart themes.
✅ Custom RSI Levels:
Dashed horizontal lines at RSI 70 (overbought), RSI 30 (oversold), and a dotted midline at 50 help you interpret trend momentum and strength.
✅ Automatic Divergence Detection:
Built-in logic identifies bullish and bearish divergences by comparing RSI and price pivot points:
🟢 Bullish Divergence: RSI makes a higher low while price makes a lower low.
🔴 Bearish Divergence: RSI makes a lower high while price makes a higher high.
Divergences are marked on the RSI line with colored lines and labels ("Bull"/"Bear").
✅ Alerts Ready:
Get notified in real-time with alert conditions for both bullish and bearish divergence setups.
Script de código aberto
Em verdadeiro espírito do TradingView, o criador deste script o tornou de código aberto, para que os traders possam revisar e verificar sua funcionalidade. Parabéns ao autor! Embora você possa usá-lo gratuitamente, lembre-se de que a republicação do código está sujeita às nossas Regras da Casa.
Aviso legal
As informações e publicações não se destinam a ser, e não constituem, conselhos ou recomendações financeiras, de investimento, comerciais ou de outro tipo fornecidos ou endossados pela TradingView. Leia mais nos Termos de Uso.