OPEN-SOURCE SCRIPT
Auto Fib Extension and Retracements
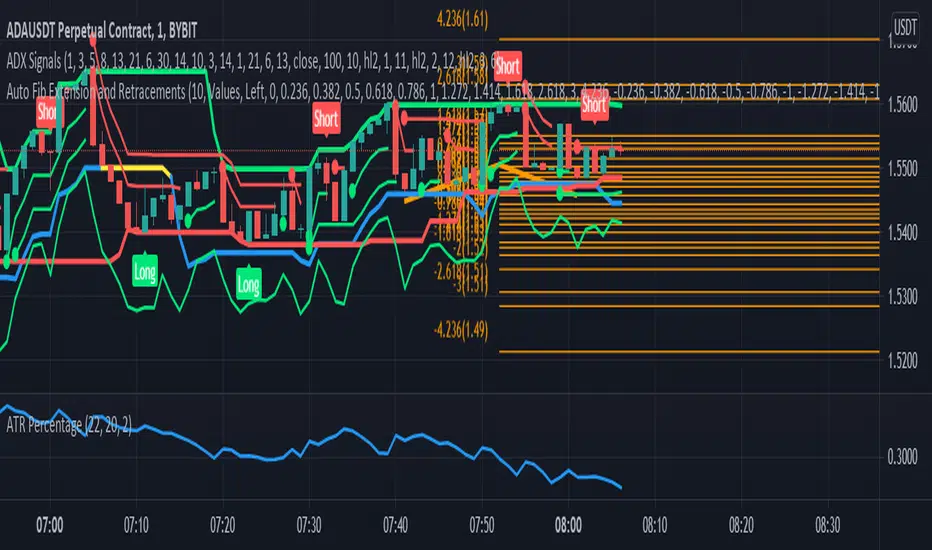
This script is used for plotting the Fibonacci support and resistance levels. Compared to other ones, the changes to this script are that you can choose what color should all the lines be and that it doesn't change the chart's size, meaning that it won't shrink the chart so that all the levels can be seen. If you have any suggestions, I'm open to anything.
Also, if you could give a like/comment or if you could follow me, that would do my day. Thank you all and enjoy!
Also, if you could give a like/comment or if you could follow me, that would do my day. Thank you all and enjoy!
Script de código aberto
Em verdadeiro espírito do TradingView, o criador deste script o tornou de código aberto, para que os traders possam revisar e verificar sua funcionalidade. Parabéns ao autor! Embora você possa usá-lo gratuitamente, lembre-se de que a republicação do código está sujeita às nossas Regras da Casa.
Aviso legal
As informações e publicações não se destinam a ser, e não constituem, conselhos ou recomendações financeiras, de investimento, comerciais ou de outro tipo fornecidos ou endossados pela TradingView. Leia mais nos Termos de Uso.