OPEN-SOURCE SCRIPT
MGC1! - Stats jour du Weekly High/Low Lun Ven
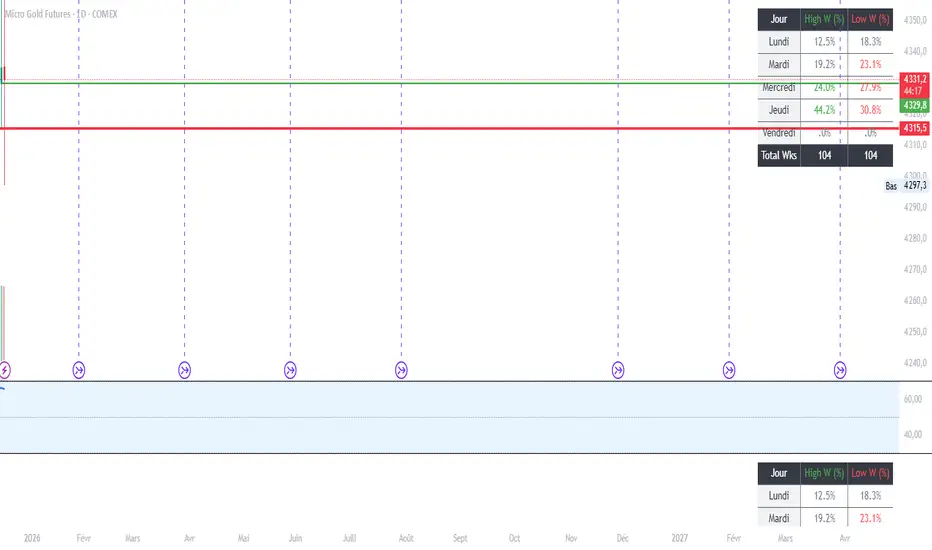
Indicator Name: Weekly High/Low Day Statistics (Probability Dashboard)
Description:
This indicator provides a statistical edge by analyzing historical price action to determine which day of the week is most likely to form the Weekly High or the Weekly Low.
Designed for intraday traders and swing traders, this tool helps you anticipate the structure of the weekly candle. By understanding the probabilities of when the extremums (HOD/LOD of the week) usually occur, you can better align your trade setups with the true weekly expansion.
Key Features:
Historical Analysis: Calculates statistics based on a user-defined lookback period (default is 104 weeks / 2 years) to ensure statistical significance.
Probability Dashboard: Displays a clean table on the chart showing the percentage chance for each day (Monday to Friday) to be the High or Low of the week.
Rolling Window: Automatically updates data at the close of every week to keep probabilities current.
How to Use (ICT/SMC Context):
Weekly Profiles: Use this data to validate "Classic Tuesday Low" or "Wednesday/Thursday Reversal" profiles.
Bias Confirmation: If the statistics show a 40% chance of the Weekly Low forming on a Tuesday, and price is diving into a Higher Timeframe POI on Tuesday morning, this adds high-probability confluence to your long setups.
Targeting: If the Weekly High typically forms on Thursday and it is currently Wednesday, you can hold runners for an expansion into the next day.
Script de código aberto
Em verdadeiro espírito do TradingView, o criador deste script o tornou de código aberto, para que os traders possam revisar e verificar sua funcionalidade. Parabéns ao autor! Embora você possa usá-lo gratuitamente, lembre-se de que a republicação do código está sujeita às nossas Regras da Casa.
Aviso legal
As informações e publicações não se destinam a ser, e não constituem, conselhos ou recomendações financeiras, de investimento, comerciais ou de outro tipo fornecidos ou endossados pela TradingView. Leia mais nos Termos de Uso.