OPEN-SOURCE SCRIPT
Price Action Health Check
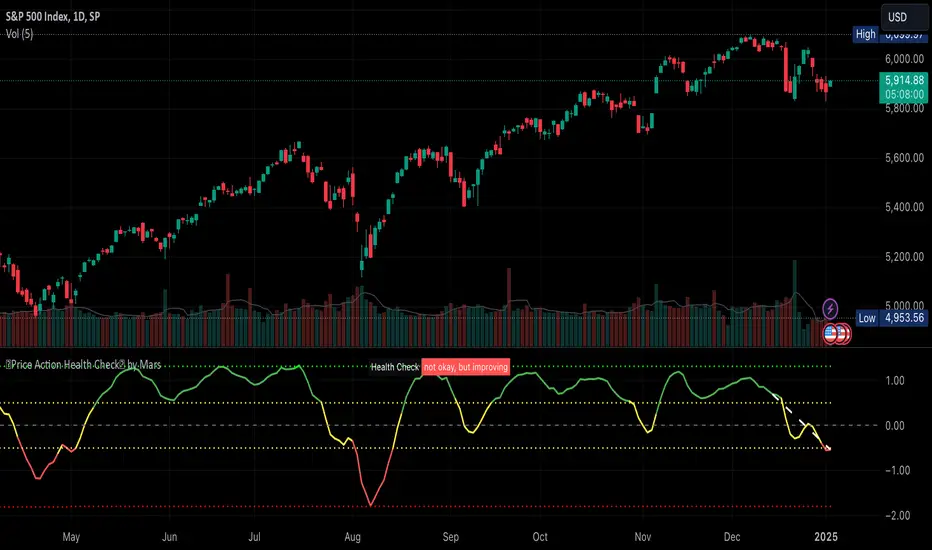
This is a price action indicator that measures market health by comparing EMAs, adapting automatically to different timeframes (Weekly/Daily more reliable) and providing context-aware health status.
Key features:
Trading applications:
I like to use it to keep SPX in check before deciding the market is going down.
Note: For optimal analysis, use primarily on Weekly and Daily timeframes where price action patterns are more significant.
Key features:
- Automatically adjusts EMA periods based on timeframe
- Measures price action health through EMA separation and historical context
- Provides visual health status with clear improvement/deterioration signals
- Projects a 13-period trend line for directional context
Trading applications:
- Identify shifts in market health before major trend changes
- Validate trend strength by comparing current readings to historical averages
- Time entries/exits based on health status transitions
- Filter trades using timeframe-specific health readings
I like to use it to keep SPX in check before deciding the market is going down.
Note: For optimal analysis, use primarily on Weekly and Daily timeframes where price action patterns are more significant.
Script de código aberto
Em verdadeiro espírito do TradingView, o criador deste script o tornou de código aberto, para que os traders possam revisar e verificar sua funcionalidade. Parabéns ao autor! Embora você possa usá-lo gratuitamente, lembre-se de que a republicação do código está sujeita às nossas Regras da Casa.
Cyclist, Trader, Technologist. Get access to data for my options indicators on smartcanvas.com for free via bots
Aviso legal
As informações e publicações não se destinam a ser, e não constituem, conselhos ou recomendações financeiras, de investimento, comerciais ou de outro tipo fornecidos ou endossados pela TradingView. Leia mais nos Termos de Uso.