OPEN-SOURCE SCRIPT
Correlation Coefficient Table
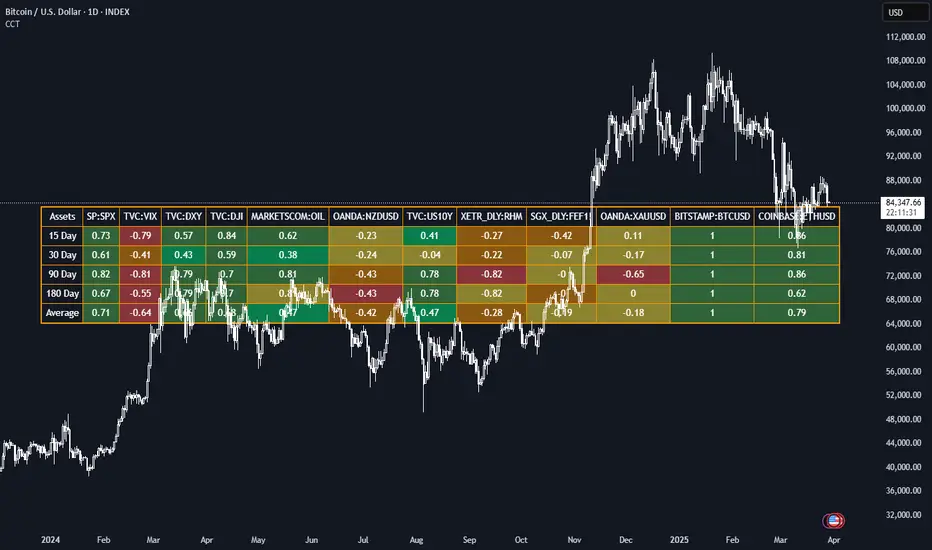
This Pine Script generates a dynamic table for analyzing how multiple assets correlate with a chosen benchmark (e.g., NZ50G). Users can input up to 12 asset symbols, customize the benchmark, and define the beta calculation periods (e.g., 15, 30, 90, 180 days). The script calculates Correlation values for each asset over these periods and computes the average beta for better insights.
The table includes:
Asset symbols: Displayed in the first row.
Correlation values: Calculated for each defined period and displayed in subsequent columns.
Average Correlation: Presented in the final column as an overall measure of correlation strength.
Color coding: Background colors indicate beta magnitude (green for high positive beta, yellow for near-neutral beta, red for negative beta).
Script de código aberto
Em verdadeiro espírito do TradingView, o criador deste script o tornou de código aberto, para que os traders possam revisar e verificar sua funcionalidade. Parabéns ao autor! Embora você possa usá-lo gratuitamente, lembre-se de que a republicação do código está sujeita às nossas Regras da Casa.
Aviso legal
As informações e publicações não se destinam a ser, e não constituem, conselhos ou recomendações financeiras, de investimento, comerciais ou de outro tipo fornecidos ou endossados pela TradingView. Leia mais nos Termos de Uso.