OPEN-SOURCE SCRIPT
Atualizado Map Multiple QQQ Levels to NQ (Custom Labels)
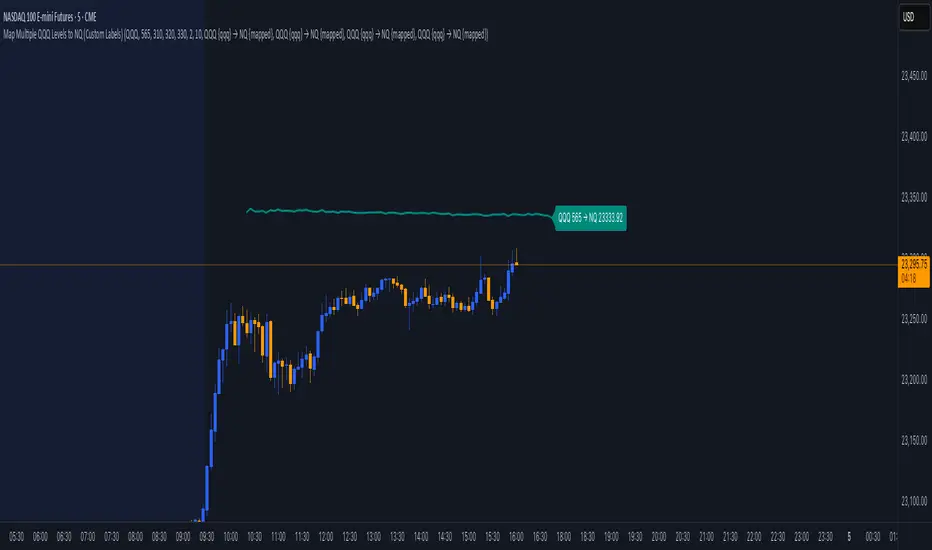
maps user-defined price levels from the QQQ (Invesco QQQ Trust, tracking the NASDAQ-100) to equivalent levels on the NQ (NASDAQ-100 futures) chart, displaying them as colored lines with optional labels. It’s designed to overlay on the NQ chart, helping traders visualize QQQ price levels in terms of NQ values based on the ratio between their prices.
Key Features:
Inputs for QQQ Levels: Users can specify up to four QQQ price levels (default: 300, 310, 320, 330) with a step of 0.1 for precision.
Customizable Appearance: Each level has its own color (default: teal, orange, purple, green) and a shared line width (default: 2).
Time Filters:
Option to display levels only for the current day (show_today_only).
Option to show levels only after 9:30 AM Eastern Time (show_after_open), aligning with market open.
Custom Labels: Each level can have a toggleable label with a customizable template (e.g., "QQQ {qqq} → NQ {mapped}"), showing the QQQ level and its mapped NQ value, formatted to two decimal places.
Dynamic Mapping: Calculates the ratio between NQ and QQQ closing prices to map QQQ levels to NQ equivalents in real-time.
Conditional Display: Levels are plotted only when user-defined conditions (day and time filters) are met, otherwise hidden (na).
Label Placement: Labels are displayed on the last confirmed historical bar, unaffected by time filters, ensuring visibility without cluttering real-time bars.
Notas de Lançamento
update chart imageNotas de Lançamento
update label distanceScript de código aberto
Em verdadeiro espírito do TradingView, o criador deste script o tornou de código aberto, para que os traders possam revisar e verificar sua funcionalidade. Parabéns ao autor! Embora você possa usá-lo gratuitamente, lembre-se de que a republicação do código está sujeita às nossas Regras da Casa.
Aviso legal
As informações e publicações não se destinam a ser, e não constituem, conselhos ou recomendações financeiras, de investimento, comerciais ou de outro tipo fornecidos ou endossados pela TradingView. Leia mais nos Termos de Uso.
Script de código aberto
Em verdadeiro espírito do TradingView, o criador deste script o tornou de código aberto, para que os traders possam revisar e verificar sua funcionalidade. Parabéns ao autor! Embora você possa usá-lo gratuitamente, lembre-se de que a republicação do código está sujeita às nossas Regras da Casa.
Aviso legal
As informações e publicações não se destinam a ser, e não constituem, conselhos ou recomendações financeiras, de investimento, comerciais ou de outro tipo fornecidos ou endossados pela TradingView. Leia mais nos Termos de Uso.