PROTECTED SOURCE SCRIPT
Atualizado Rs Candlestick Indicator With Moving Averages
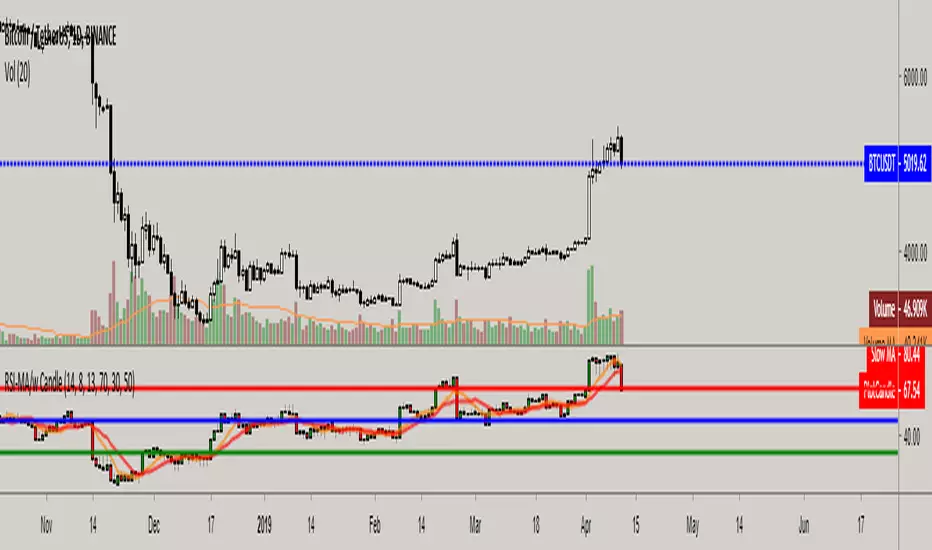
Unlike the traditional RSI, this one offers you an detailed insight with candlestick chart, rather than a simple line setup. It also includes two different customizable moving average(s) and offers detailed information such as bullish/bearish candlestick formations, negative and positive divergences on indicator.
How to use: Similar to candlestick charts, whenever Rsi candle close and stays above moving average(s) it's a buy signal and whenever candle closes below moving average(s), that's a sell signal. Rather than waiting for Rsi to break mid-line(50) to buy and sell, this one offers dynamic and more accurate buy and sell signals. You can also customize top-mid-bottom line values as well to determine overbought and oversold levels.
How to use: Similar to candlestick charts, whenever Rsi candle close and stays above moving average(s) it's a buy signal and whenever candle closes below moving average(s), that's a sell signal. Rather than waiting for Rsi to break mid-line(50) to buy and sell, this one offers dynamic and more accurate buy and sell signals. You can also customize top-mid-bottom line values as well to determine overbought and oversold levels.
Notas de Lançamento
Added mid-line color.Script protegido
Esse script é publicada como código fechado. No entanto, você pode gerenciar suas escolhas de bate-papo. Por favor, abra suas Configurações do perfil
Aviso legal
As informações e publicações não se destinam a ser, e não constituem, conselhos ou recomendações financeiras, de investimento, comerciais ou de outro tipo fornecidos ou endossados pela TradingView. Leia mais nos Termos de Uso.
Script protegido
Esse script é publicada como código fechado. No entanto, você pode gerenciar suas escolhas de bate-papo. Por favor, abra suas Configurações do perfil
Aviso legal
As informações e publicações não se destinam a ser, e não constituem, conselhos ou recomendações financeiras, de investimento, comerciais ou de outro tipo fornecidos ou endossados pela TradingView. Leia mais nos Termos de Uso.