OPEN-SOURCE SCRIPT
HT: Weekly Levels
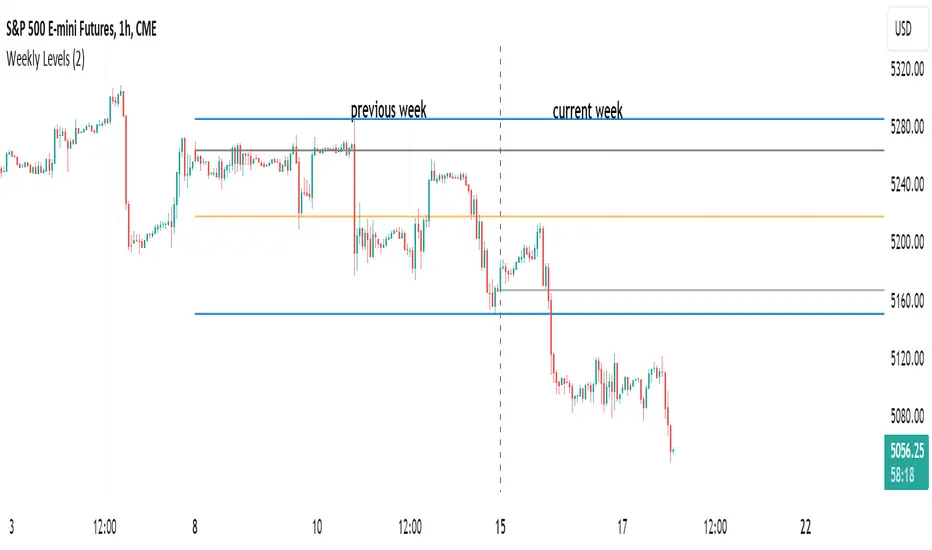
Indicator draws several most important weekly levels on the lower timeframe: last week high/low, halfback, week close and current week open. These levels often act as support/resistance for price movements. Also, they can help to assess week character and control of power.
Indicator can be used on any timeframe, lower than weekly, for any type of instrument, including futures. It also provides an option to draw levels for any selected week back in time.
Important notes:
• Levels for the last week are drawn after the new week opens.
• Half-back is calculated as a middle line between week High and Low.
Parameters:
Date – user can select date, belonging to week, for which levels will be plotted. Works only if “Use” check box is on. Otherwise, levels will be plotted for the last week. (“time” value doesn’t matter; unfortunately, there is no way to hide the input box)
Time zone – your chart time zone (as UTC offset). Only needed if you use “Date” parameter.
Visuals – controls visibility and colors
Script is published as an open source. It uses two libraries: Levels Lib and Functions Lib. First one demonstrates how to work with pine-script object model and arrays. You can also reuse it in your custom scripts where there is need to construct any support/resistance levels. The second library contains some useful functions for working with time and dates.
Disclaimer
This indicator should not be used as a standalone tool to make trading decisions but only in conjunction with other technical analysis methods.
Script de código aberto
Em verdadeiro espírito do TradingView, o criador deste script o tornou de código aberto, para que os traders possam revisar e verificar sua funcionalidade. Parabéns ao autor! Embora você possa usá-lo gratuitamente, lembre-se de que a republicação do código está sujeita às nossas Regras da Casa.
Aviso legal
As informações e publicações não se destinam a ser, e não constituem, conselhos ou recomendações financeiras, de investimento, comerciais ou de outro tipo fornecidos ou endossados pela TradingView. Leia mais nos Termos de Uso.