OPEN-SOURCE SCRIPT
Stock Highs Tracker
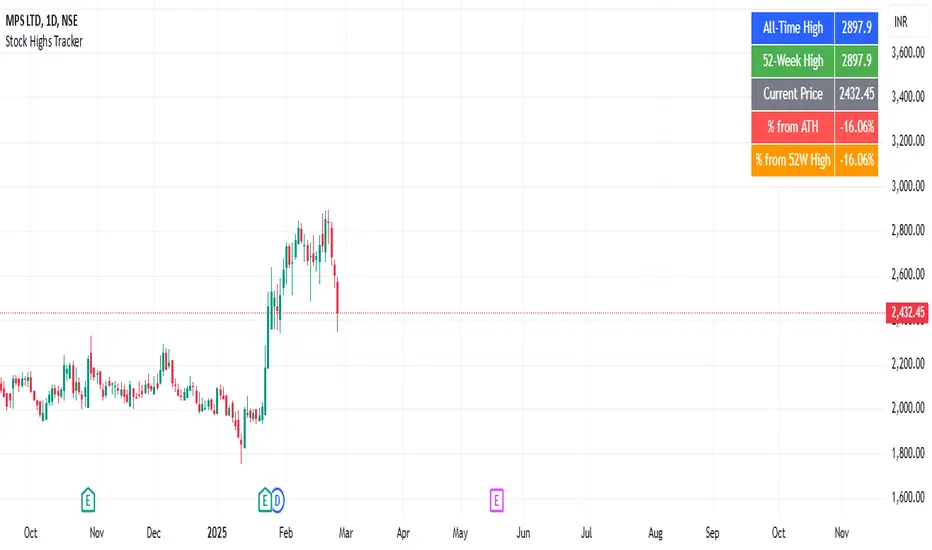
This indicator tracks key stock price levels including the all-time high (ATH), 52-week high, and current price.
It calculates the percentage difference of the current price from both the ATH and 52-week high.
The data is displayed in a table at the top-right corner of the chart, allowing traders to quickly assess the stock’s performance relative to its historical highs.
This is useful for identifying stocks trading near their highs or experiencing significant pullbacks.
Script de código aberto
Em verdadeiro espírito do TradingView, o criador deste script o tornou de código aberto, para que os traders possam revisar e verificar sua funcionalidade. Parabéns ao autor! Embora você possa usá-lo gratuitamente, lembre-se de que a republicação do código está sujeita às nossas Regras da Casa.
Aviso legal
As informações e publicações não se destinam a ser, e não constituem, conselhos ou recomendações financeiras, de investimento, comerciais ou de outro tipo fornecidos ou endossados pela TradingView. Leia mais nos Termos de Uso.