OPEN-SOURCE SCRIPT
Atualizado Ichimoku Peeks
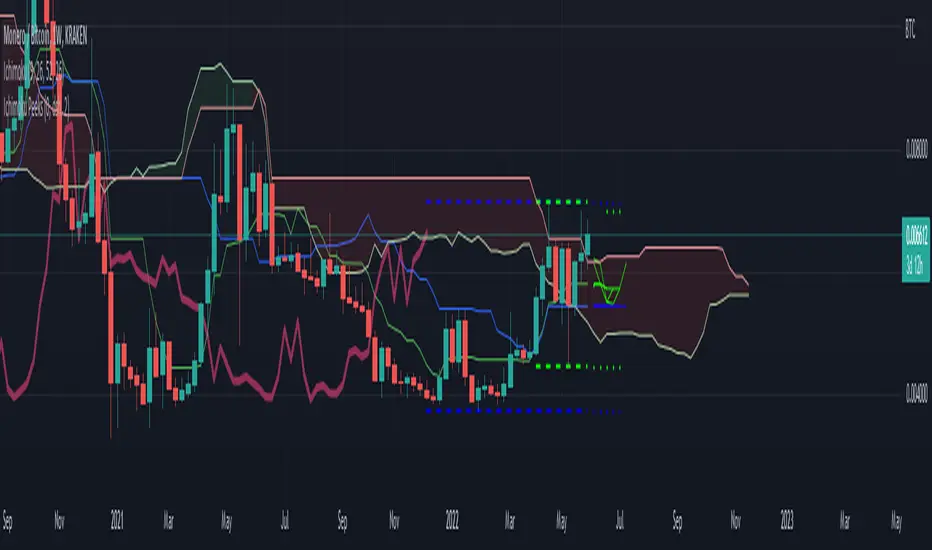
This indicator uses the Ichimoku Tenkan / Kijun trend line formulas to predict what those values will be in the future if current price action does not violate the period highs and lows.
Because of the way Ichimoku formulates the trend, it contains (but does not visualize) this predictive information in a way that moving averages do not.
Sharp chart readers can infer upcoming changes by counting back candles, but the process can be automated, as I've shown here.
This description does not seem to be editable so implementation details and usage will be covered in code commentary.
Notas de Lançamento
* Fixed first prediction not rendering in some configs.* Added input boundary lines to show where calculation data is pulled from (off by default).
* Minor config organization.
Notas de Lançamento
* Bugfix for visual artifacts. History of first projection was displayed in simple mode as infinite cross tail.* Adjusted "input boundary" diagnostic so that it more coherently relates to the projections. Now first projection drops last candle in channel.
Notas de Lançamento
In this update:* More code commentary about usage and theory.
* Input boundaries are now on by default and configurable.
* Input boundaries are extended by default into projected range via `Show Highs/Lows` option.
Notas de Lançamento
* Minor comment update to replace preview chart.Notas de Lançamento
Documentation and preview update.Notas de Lançamento
* Added built in Ichimoku via (lib-hlm)* Removed later projections due to less confidence and to make room for Ichimoku.
* Documentation updates.
* Option to fill in the boundary zones.
Script de código aberto
Em verdadeiro espírito do TradingView, o criador deste script o tornou de código aberto, para que os traders possam revisar e verificar sua funcionalidade. Parabéns ao autor! Embora você possa usá-lo gratuitamente, lembre-se de que a republicação do código está sujeita às nossas Regras da Casa.
Aviso legal
As informações e publicações não se destinam a ser, e não constituem, conselhos ou recomendações financeiras, de investimento, comerciais ou de outro tipo fornecidos ou endossados pela TradingView. Leia mais nos Termos de Uso.